Immigrants from Ghana vs Immigrants from Sudan Disability Age 5 to 17
COMPARE
Immigrants from Ghana
Immigrants from Sudan
Disability Age 5 to 17
Disability Age 5 to 17 Comparison
Immigrants from Ghana
Immigrants from Sudan
5.9%
DISABILITY AGE 5 TO 17
1.7/ 100
METRIC RATING
249th/ 347
METRIC RANK
5.8%
DISABILITY AGE 5 TO 17
6.7/ 100
METRIC RATING
222nd/ 347
METRIC RANK
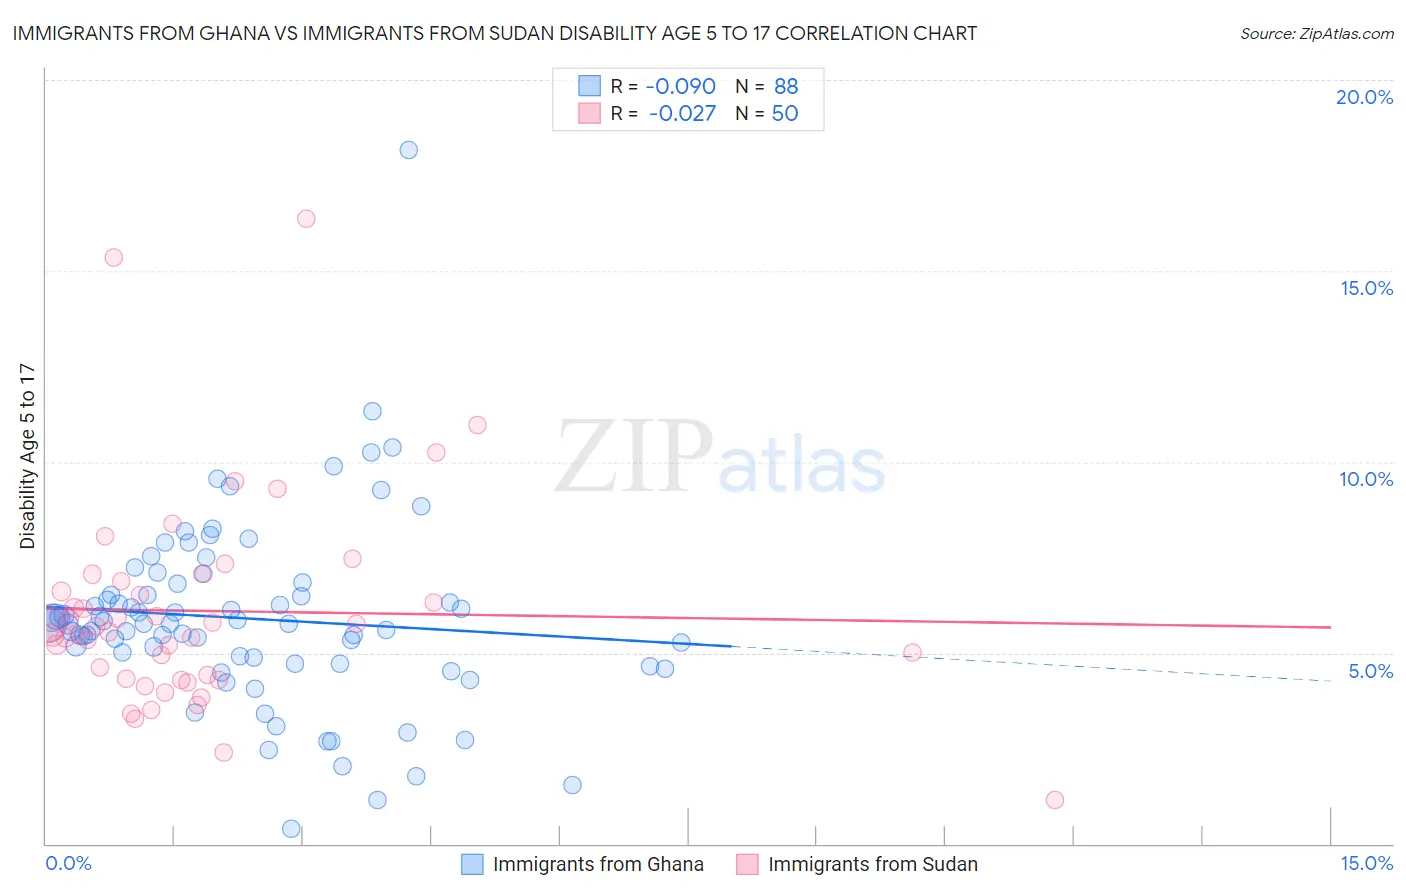
Immigrants from Ghana vs Immigrants from Sudan Disability Age 5 to 17 Correlation Chart
The statistical analysis conducted on geographies consisting of 199,220,880 people shows a slight negative correlation between the proportion of Immigrants from Ghana and percentage of population with a disability between the ages 5 and 17 in the United States with a correlation coefficient (R) of -0.090 and weighted average of 5.9%. Similarly, the statistical analysis conducted on geographies consisting of 118,823,515 people shows no correlation between the proportion of Immigrants from Sudan and percentage of population with a disability between the ages 5 and 17 in the United States with a correlation coefficient (R) of -0.027 and weighted average of 5.8%, a difference of 1.7%.
Disability Age 5 to 17 Correlation Summary
| Measurement | Immigrants from Ghana | Immigrants from Sudan |
| Minimum | 0.40% | 1.2% |
| Maximum | 18.2% | 16.4% |
| Range | 17.8% | 15.2% |
| Mean | 5.9% | 6.1% |
| Median | 5.8% | 5.6% |
| Interquartile 25% (IQ1) | 4.8% | 4.3% |
| Interquartile 75% (IQ3) | 6.7% | 6.9% |
| Interquartile Range (IQR) | 1.9% | 2.6% |
| Standard Deviation (Sample) | 2.5% | 2.8% |
| Standard Deviation (Population) | 2.4% | 2.7% |
Similar Demographics by Disability Age 5 to 17
Demographics Similar to Immigrants from Ghana by Disability Age 5 to 17
In terms of disability age 5 to 17, the demographic groups most similar to Immigrants from Ghana are British (5.9%, a difference of 0.010%), Immigrants from Honduras (5.9%, a difference of 0.090%), Immigrants from Germany (5.9%, a difference of 0.12%), Immigrants from Micronesia (5.9%, a difference of 0.12%), and Tlingit-Haida (5.9%, a difference of 0.12%).
| Demographics | Rating | Rank | Disability Age 5 to 17 |
| Spaniards | 2.0 /100 | #242 | Tragic 5.9% |
| Indonesians | 2.0 /100 | #243 | Tragic 5.9% |
| Immigrants | Germany | 1.9 /100 | #244 | Tragic 5.9% |
| Immigrants | Micronesia | 1.9 /100 | #245 | Tragic 5.9% |
| Tlingit-Haida | 1.9 /100 | #246 | Tragic 5.9% |
| Immigrants | Honduras | 1.8 /100 | #247 | Tragic 5.9% |
| British | 1.7 /100 | #248 | Tragic 5.9% |
| Immigrants | Ghana | 1.7 /100 | #249 | Tragic 5.9% |
| Poles | 1.5 /100 | #250 | Tragic 5.9% |
| Immigrants | Cambodia | 1.5 /100 | #251 | Tragic 5.9% |
| Hondurans | 1.5 /100 | #252 | Tragic 5.9% |
| Scandinavians | 1.4 /100 | #253 | Tragic 5.9% |
| Barbadians | 1.3 /100 | #254 | Tragic 5.9% |
| Italians | 1.2 /100 | #255 | Tragic 5.9% |
| Hopi | 1.0 /100 | #256 | Tragic 5.9% |
Demographics Similar to Immigrants from Sudan by Disability Age 5 to 17
In terms of disability age 5 to 17, the demographic groups most similar to Immigrants from Sudan are Lithuanian (5.8%, a difference of 0.0%), Belgian (5.8%, a difference of 0.040%), Sierra Leonean (5.8%, a difference of 0.060%), Immigrants from Sierra Leone (5.8%, a difference of 0.070%), and Czech (5.8%, a difference of 0.12%).
| Demographics | Rating | Rank | Disability Age 5 to 17 |
| Swedes | 8.1 /100 | #215 | Tragic 5.8% |
| Nigerians | 7.5 /100 | #216 | Tragic 5.8% |
| Czechs | 7.4 /100 | #217 | Tragic 5.8% |
| Immigrants | Sierra Leone | 7.1 /100 | #218 | Tragic 5.8% |
| Sierra Leoneans | 7.0 /100 | #219 | Tragic 5.8% |
| Belgians | 6.9 /100 | #220 | Tragic 5.8% |
| Lithuanians | 6.7 /100 | #221 | Tragic 5.8% |
| Immigrants | Sudan | 6.7 /100 | #222 | Tragic 5.8% |
| Alsatians | 6.0 /100 | #223 | Tragic 5.8% |
| Mexicans | 5.7 /100 | #224 | Tragic 5.8% |
| Guamanians/Chamorros | 5.6 /100 | #225 | Tragic 5.8% |
| British West Indians | 5.4 /100 | #226 | Tragic 5.8% |
| Swiss | 5.1 /100 | #227 | Tragic 5.8% |
| Haitians | 4.8 /100 | #228 | Tragic 5.8% |
| Bangladeshis | 4.8 /100 | #229 | Tragic 5.8% |