Immigrants from Ghana vs Jamaican Disability Age 5 to 17
COMPARE
Immigrants from Ghana
Jamaican
Disability Age 5 to 17
Disability Age 5 to 17 Comparison
Immigrants from Ghana
Jamaicans
5.9%
DISABILITY AGE 5 TO 17
1.7/ 100
METRIC RATING
249th/ 347
METRIC RANK
6.2%
DISABILITY AGE 5 TO 17
0.0/ 100
METRIC RATING
288th/ 347
METRIC RANK
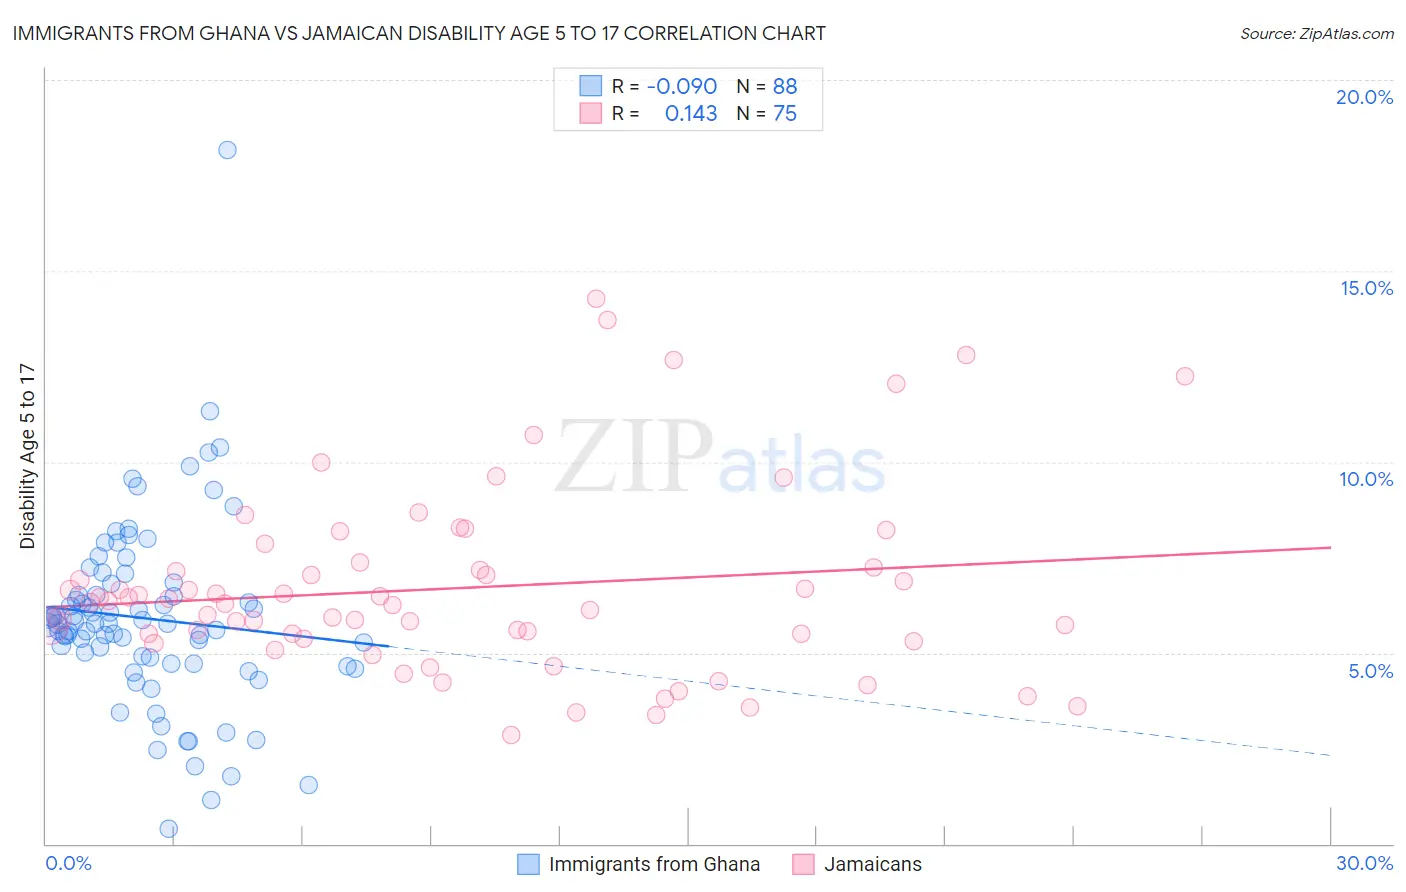
Immigrants from Ghana vs Jamaican Disability Age 5 to 17 Correlation Chart
The statistical analysis conducted on geographies consisting of 199,220,880 people shows a slight negative correlation between the proportion of Immigrants from Ghana and percentage of population with a disability between the ages 5 and 17 in the United States with a correlation coefficient (R) of -0.090 and weighted average of 5.9%. Similarly, the statistical analysis conducted on geographies consisting of 365,362,529 people shows a poor positive correlation between the proportion of Jamaicans and percentage of population with a disability between the ages 5 and 17 in the United States with a correlation coefficient (R) of 0.143 and weighted average of 6.2%, a difference of 5.3%.
Disability Age 5 to 17 Correlation Summary
| Measurement | Immigrants from Ghana | Jamaican |
| Minimum | 0.40% | 2.8% |
| Maximum | 18.2% | 14.3% |
| Range | 17.8% | 11.5% |
| Mean | 5.9% | 6.7% |
| Median | 5.8% | 6.3% |
| Interquartile 25% (IQ1) | 4.8% | 5.4% |
| Interquartile 75% (IQ3) | 6.7% | 7.2% |
| Interquartile Range (IQR) | 1.9% | 1.8% |
| Standard Deviation (Sample) | 2.5% | 2.4% |
| Standard Deviation (Population) | 2.4% | 2.4% |
Similar Demographics by Disability Age 5 to 17
Demographics Similar to Immigrants from Ghana by Disability Age 5 to 17
In terms of disability age 5 to 17, the demographic groups most similar to Immigrants from Ghana are British (5.9%, a difference of 0.010%), Immigrants from Honduras (5.9%, a difference of 0.090%), Immigrants from Germany (5.9%, a difference of 0.12%), Immigrants from Micronesia (5.9%, a difference of 0.12%), and Tlingit-Haida (5.9%, a difference of 0.12%).
| Demographics | Rating | Rank | Disability Age 5 to 17 |
| Spaniards | 2.0 /100 | #242 | Tragic 5.9% |
| Indonesians | 2.0 /100 | #243 | Tragic 5.9% |
| Immigrants | Germany | 1.9 /100 | #244 | Tragic 5.9% |
| Immigrants | Micronesia | 1.9 /100 | #245 | Tragic 5.9% |
| Tlingit-Haida | 1.9 /100 | #246 | Tragic 5.9% |
| Immigrants | Honduras | 1.8 /100 | #247 | Tragic 5.9% |
| British | 1.7 /100 | #248 | Tragic 5.9% |
| Immigrants | Ghana | 1.7 /100 | #249 | Tragic 5.9% |
| Poles | 1.5 /100 | #250 | Tragic 5.9% |
| Immigrants | Cambodia | 1.5 /100 | #251 | Tragic 5.9% |
| Hondurans | 1.5 /100 | #252 | Tragic 5.9% |
| Scandinavians | 1.4 /100 | #253 | Tragic 5.9% |
| Barbadians | 1.3 /100 | #254 | Tragic 5.9% |
| Italians | 1.2 /100 | #255 | Tragic 5.9% |
| Hopi | 1.0 /100 | #256 | Tragic 5.9% |
Demographics Similar to Jamaicans by Disability Age 5 to 17
In terms of disability age 5 to 17, the demographic groups most similar to Jamaicans are Yaqui (6.2%, a difference of 0.010%), Immigrants from Congo (6.2%, a difference of 0.010%), White/Caucasian (6.2%, a difference of 0.15%), Pima (6.2%, a difference of 0.26%), and Immigrants from Senegal (6.2%, a difference of 0.40%).
| Demographics | Rating | Rank | Disability Age 5 to 17 |
| Scottish | 0.0 /100 | #281 | Tragic 6.1% |
| Germans | 0.0 /100 | #282 | Tragic 6.1% |
| Ugandans | 0.0 /100 | #283 | Tragic 6.2% |
| Sub-Saharan Africans | 0.0 /100 | #284 | Tragic 6.2% |
| English | 0.0 /100 | #285 | Tragic 6.2% |
| Colville | 0.0 /100 | #286 | Tragic 6.2% |
| Pima | 0.0 /100 | #287 | Tragic 6.2% |
| Jamaicans | 0.0 /100 | #288 | Tragic 6.2% |
| Yaqui | 0.0 /100 | #289 | Tragic 6.2% |
| Immigrants | Congo | 0.0 /100 | #290 | Tragic 6.2% |
| Whites/Caucasians | 0.0 /100 | #291 | Tragic 6.2% |
| Immigrants | Senegal | 0.0 /100 | #292 | Tragic 6.2% |
| Central American Indians | 0.0 /100 | #293 | Tragic 6.2% |
| Irish | 0.0 /100 | #294 | Tragic 6.2% |
| Cree | 0.0 /100 | #295 | Tragic 6.2% |