Immigrants from Ghana vs Immigrants from Brazil Disability
COMPARE
Immigrants from Ghana
Immigrants from Brazil
Disability
Disability Comparison
Immigrants from Ghana
Immigrants from Brazil
11.6%
DISABILITY
71.2/ 100
METRIC RATING
153rd/ 347
METRIC RANK
11.2%
DISABILITY
98.1/ 100
METRIC RATING
90th/ 347
METRIC RANK
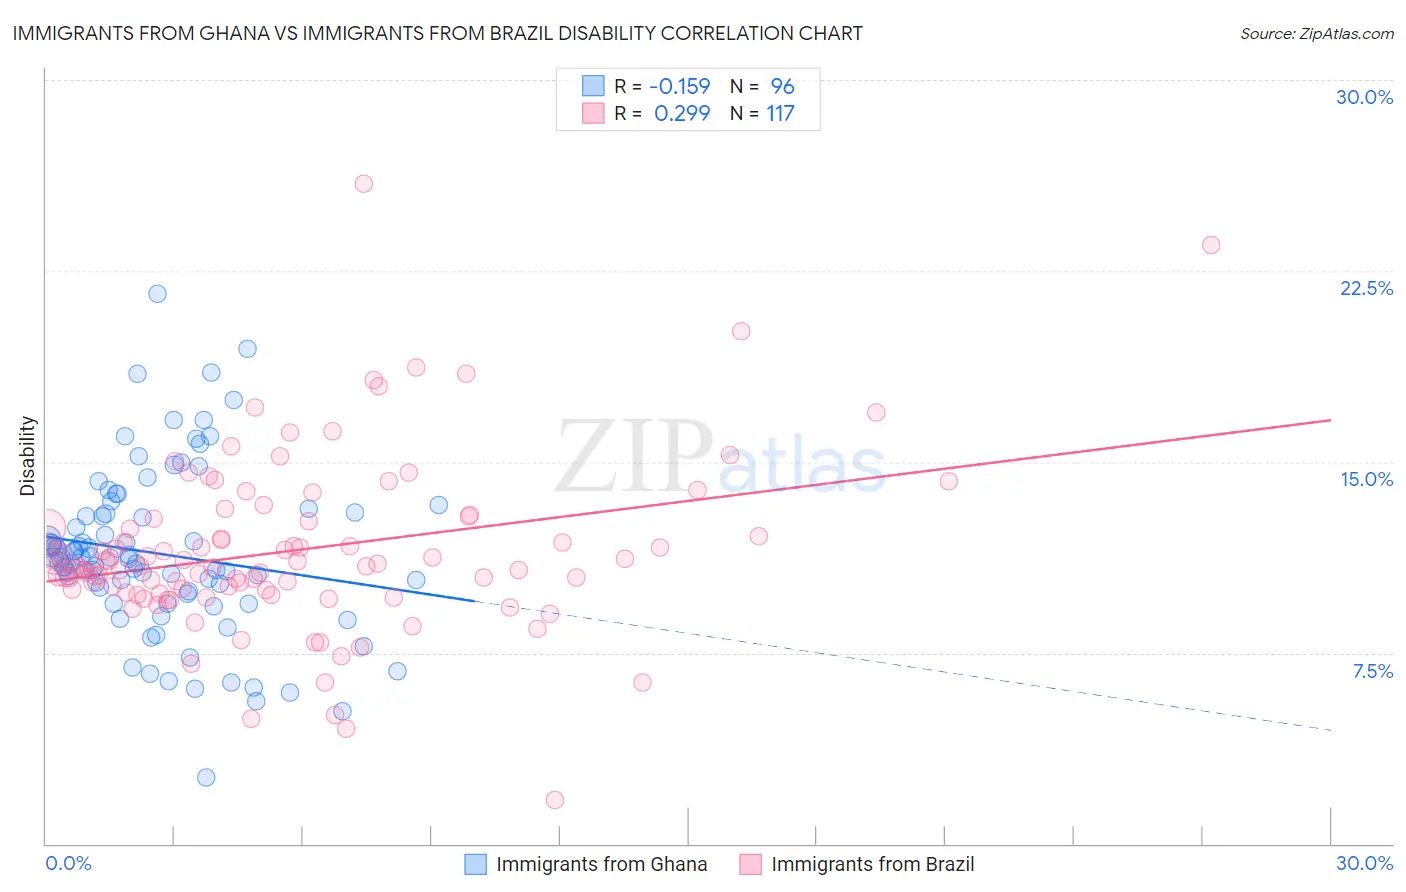
Immigrants from Ghana vs Immigrants from Brazil Disability Correlation Chart
The statistical analysis conducted on geographies consisting of 199,930,208 people shows a poor negative correlation between the proportion of Immigrants from Ghana and percentage of population with a disability in the United States with a correlation coefficient (R) of -0.159 and weighted average of 11.6%. Similarly, the statistical analysis conducted on geographies consisting of 343,011,527 people shows a weak positive correlation between the proportion of Immigrants from Brazil and percentage of population with a disability in the United States with a correlation coefficient (R) of 0.299 and weighted average of 11.2%, a difference of 3.5%.
Disability Correlation Summary
| Measurement | Immigrants from Ghana | Immigrants from Brazil |
| Minimum | 2.6% | 1.7% |
| Maximum | 21.6% | 25.9% |
| Range | 19.0% | 24.2% |
| Mean | 11.4% | 11.5% |
| Median | 11.2% | 10.9% |
| Interquartile 25% (IQ1) | 9.9% | 9.9% |
| Interquartile 75% (IQ3) | 13.0% | 12.7% |
| Interquartile Range (IQR) | 3.1% | 2.8% |
| Standard Deviation (Sample) | 3.3% | 3.4% |
| Standard Deviation (Population) | 3.3% | 3.4% |
Similar Demographics by Disability
Demographics Similar to Immigrants from Ghana by Disability
In terms of disability, the demographic groups most similar to Immigrants from Ghana are Immigrants from Guatemala (11.6%, a difference of 0.0%), Immigrants from Kenya (11.6%, a difference of 0.050%), Immigrants from Moldova (11.6%, a difference of 0.050%), Romanian (11.6%, a difference of 0.080%), and Immigrants from Netherlands (11.6%, a difference of 0.080%).
| Demographics | Rating | Rank | Disability |
| Immigrants | Hungary | 79.0 /100 | #146 | Good 11.5% |
| Immigrants | Ukraine | 77.6 /100 | #147 | Good 11.5% |
| Sudanese | 77.1 /100 | #148 | Good 11.5% |
| Immigrants | Norway | 73.2 /100 | #149 | Good 11.6% |
| Romanians | 72.7 /100 | #150 | Good 11.6% |
| Immigrants | Kenya | 72.1 /100 | #151 | Good 11.6% |
| Immigrants | Moldova | 72.0 /100 | #152 | Good 11.6% |
| Immigrants | Ghana | 71.2 /100 | #153 | Good 11.6% |
| Immigrants | Guatemala | 71.1 /100 | #154 | Good 11.6% |
| Immigrants | Netherlands | 69.8 /100 | #155 | Good 11.6% |
| Immigrants | Fiji | 69.5 /100 | #156 | Good 11.6% |
| Immigrants | Middle Africa | 69.5 /100 | #157 | Good 11.6% |
| Armenians | 65.9 /100 | #158 | Good 11.6% |
| Guatemalans | 65.1 /100 | #159 | Good 11.6% |
| Immigrants | Barbados | 64.2 /100 | #160 | Good 11.6% |
Demographics Similar to Immigrants from Brazil by Disability
In terms of disability, the demographic groups most similar to Immigrants from Brazil are Immigrants from Western Asia (11.2%, a difference of 0.020%), Immigrants from South Africa (11.2%, a difference of 0.050%), Ecuadorian (11.2%, a difference of 0.060%), Immigrants from Ecuador (11.2%, a difference of 0.060%), and Immigrants from Morocco (11.2%, a difference of 0.18%).
| Demographics | Rating | Rank | Disability |
| Immigrants | Switzerland | 99.0 /100 | #83 | Exceptional 11.1% |
| Immigrants | Sierra Leone | 99.0 /100 | #84 | Exceptional 11.1% |
| Immigrants | Belarus | 98.9 /100 | #85 | Exceptional 11.1% |
| Immigrants | Russia | 98.9 /100 | #86 | Exceptional 11.1% |
| Palestinians | 98.9 /100 | #87 | Exceptional 11.1% |
| Immigrants | Romania | 98.5 /100 | #88 | Exceptional 11.2% |
| Immigrants | South Africa | 98.2 /100 | #89 | Exceptional 11.2% |
| Immigrants | Brazil | 98.1 /100 | #90 | Exceptional 11.2% |
| Immigrants | Western Asia | 98.1 /100 | #91 | Exceptional 11.2% |
| Ecuadorians | 98.0 /100 | #92 | Exceptional 11.2% |
| Immigrants | Ecuador | 98.0 /100 | #93 | Exceptional 11.2% |
| Immigrants | Morocco | 97.8 /100 | #94 | Exceptional 11.2% |
| Eastern Europeans | 97.8 /100 | #95 | Exceptional 11.2% |
| Immigrants | Zimbabwe | 97.7 /100 | #96 | Exceptional 11.2% |
| Bhutanese | 97.4 /100 | #97 | Exceptional 11.2% |