Immigrants from Ghana vs Kiowa 5th Grade
COMPARE
Immigrants from Ghana
Kiowa
5th Grade
5th Grade Comparison
Immigrants from Ghana
Kiowa
96.6%
5TH GRADE
0.1/ 100
METRIC RATING
278th/ 347
METRIC RANK
97.9%
5TH GRADE
99.5/ 100
METRIC RATING
69th/ 347
METRIC RANK
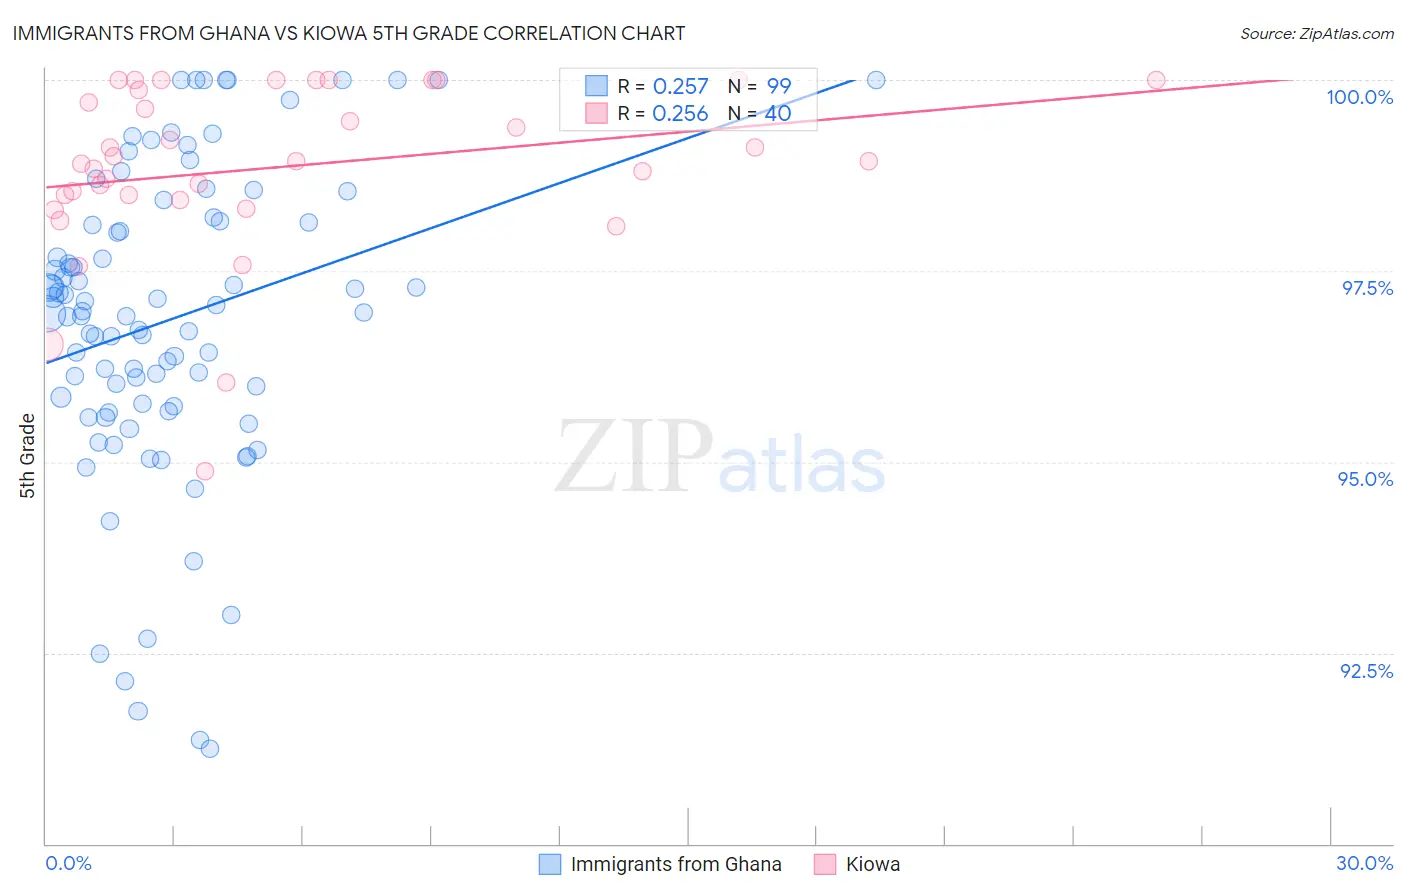
Immigrants from Ghana vs Kiowa 5th Grade Correlation Chart
The statistical analysis conducted on geographies consisting of 199,952,023 people shows a weak positive correlation between the proportion of Immigrants from Ghana and percentage of population with at least 5th grade education in the United States with a correlation coefficient (R) of 0.257 and weighted average of 96.6%. Similarly, the statistical analysis conducted on geographies consisting of 56,100,633 people shows a weak positive correlation between the proportion of Kiowa and percentage of population with at least 5th grade education in the United States with a correlation coefficient (R) of 0.256 and weighted average of 97.9%, a difference of 1.3%.
5th Grade Correlation Summary
| Measurement | Immigrants from Ghana | Kiowa |
| Minimum | 91.2% | 94.9% |
| Maximum | 100.0% | 100.0% |
| Range | 8.8% | 5.1% |
| Mean | 96.9% | 98.9% |
| Median | 97.0% | 98.9% |
| Interquartile 25% (IQ1) | 95.7% | 98.5% |
| Interquartile 75% (IQ3) | 98.1% | 99.9% |
| Interquartile Range (IQR) | 2.4% | 1.5% |
| Standard Deviation (Sample) | 2.0% | 1.1% |
| Standard Deviation (Population) | 2.0% | 1.1% |
Similar Demographics by 5th Grade
Demographics Similar to Immigrants from Ghana by 5th Grade
In terms of 5th grade, the demographic groups most similar to Immigrants from Ghana are Immigrants from Peru (96.6%, a difference of 0.010%), Cuban (96.6%, a difference of 0.010%), Immigrants from Bolivia (96.6%, a difference of 0.010%), Immigrants from Philippines (96.6%, a difference of 0.010%), and Yaqui (96.7%, a difference of 0.020%).
| Demographics | Rating | Rank | 5th Grade |
| Immigrants | Hong Kong | 0.2 /100 | #271 | Tragic 96.7% |
| Trinidadians and Tobagonians | 0.1 /100 | #272 | Tragic 96.7% |
| Yaqui | 0.1 /100 | #273 | Tragic 96.7% |
| Immigrants | Cameroon | 0.1 /100 | #274 | Tragic 96.7% |
| Immigrants | Peru | 0.1 /100 | #275 | Tragic 96.6% |
| Cubans | 0.1 /100 | #276 | Tragic 96.6% |
| Immigrants | Bolivia | 0.1 /100 | #277 | Tragic 96.6% |
| Immigrants | Ghana | 0.1 /100 | #278 | Tragic 96.6% |
| Immigrants | Philippines | 0.1 /100 | #279 | Tragic 96.6% |
| Immigrants | Western Africa | 0.1 /100 | #280 | Tragic 96.6% |
| Houma | 0.1 /100 | #281 | Tragic 96.6% |
| Barbadians | 0.1 /100 | #282 | Tragic 96.6% |
| Fijians | 0.1 /100 | #283 | Tragic 96.6% |
| Immigrants | Trinidad and Tobago | 0.1 /100 | #284 | Tragic 96.6% |
| Immigrants | St. Vincent and the Grenadines | 0.1 /100 | #285 | Tragic 96.6% |
Demographics Similar to Kiowa by 5th Grade
In terms of 5th grade, the demographic groups most similar to Kiowa are Cajun (97.9%, a difference of 0.010%), Iranian (97.9%, a difference of 0.010%), Chickasaw (97.9%, a difference of 0.010%), Immigrants from Austria (97.9%, a difference of 0.020%), and New Zealander (97.9%, a difference of 0.020%).
| Demographics | Rating | Rank | 5th Grade |
| Immigrants | North America | 99.7 /100 | #62 | Exceptional 97.9% |
| Russians | 99.7 /100 | #63 | Exceptional 97.9% |
| Immigrants | Northern Europe | 99.6 /100 | #64 | Exceptional 97.9% |
| Canadians | 99.6 /100 | #65 | Exceptional 97.9% |
| Immigrants | Austria | 99.6 /100 | #66 | Exceptional 97.9% |
| New Zealanders | 99.6 /100 | #67 | Exceptional 97.9% |
| Cajuns | 99.6 /100 | #68 | Exceptional 97.9% |
| Kiowa | 99.5 /100 | #69 | Exceptional 97.9% |
| Iranians | 99.5 /100 | #70 | Exceptional 97.9% |
| Chickasaw | 99.5 /100 | #71 | Exceptional 97.9% |
| Macedonians | 99.4 /100 | #72 | Exceptional 97.9% |
| Cherokee | 99.4 /100 | #73 | Exceptional 97.8% |
| Lumbee | 99.3 /100 | #74 | Exceptional 97.8% |
| Ukrainians | 99.3 /100 | #75 | Exceptional 97.8% |
| Immigrants | Netherlands | 99.3 /100 | #76 | Exceptional 97.8% |