Immigrants from Ghana vs South African Male Disability
COMPARE
Immigrants from Ghana
South African
Male Disability
Male Disability Comparison
Immigrants from Ghana
South Africans
10.9%
MALE DISABILITY
89.0/ 100
METRIC RATING
122nd/ 347
METRIC RANK
11.0%
MALE DISABILITY
81.7/ 100
METRIC RATING
139th/ 347
METRIC RANK
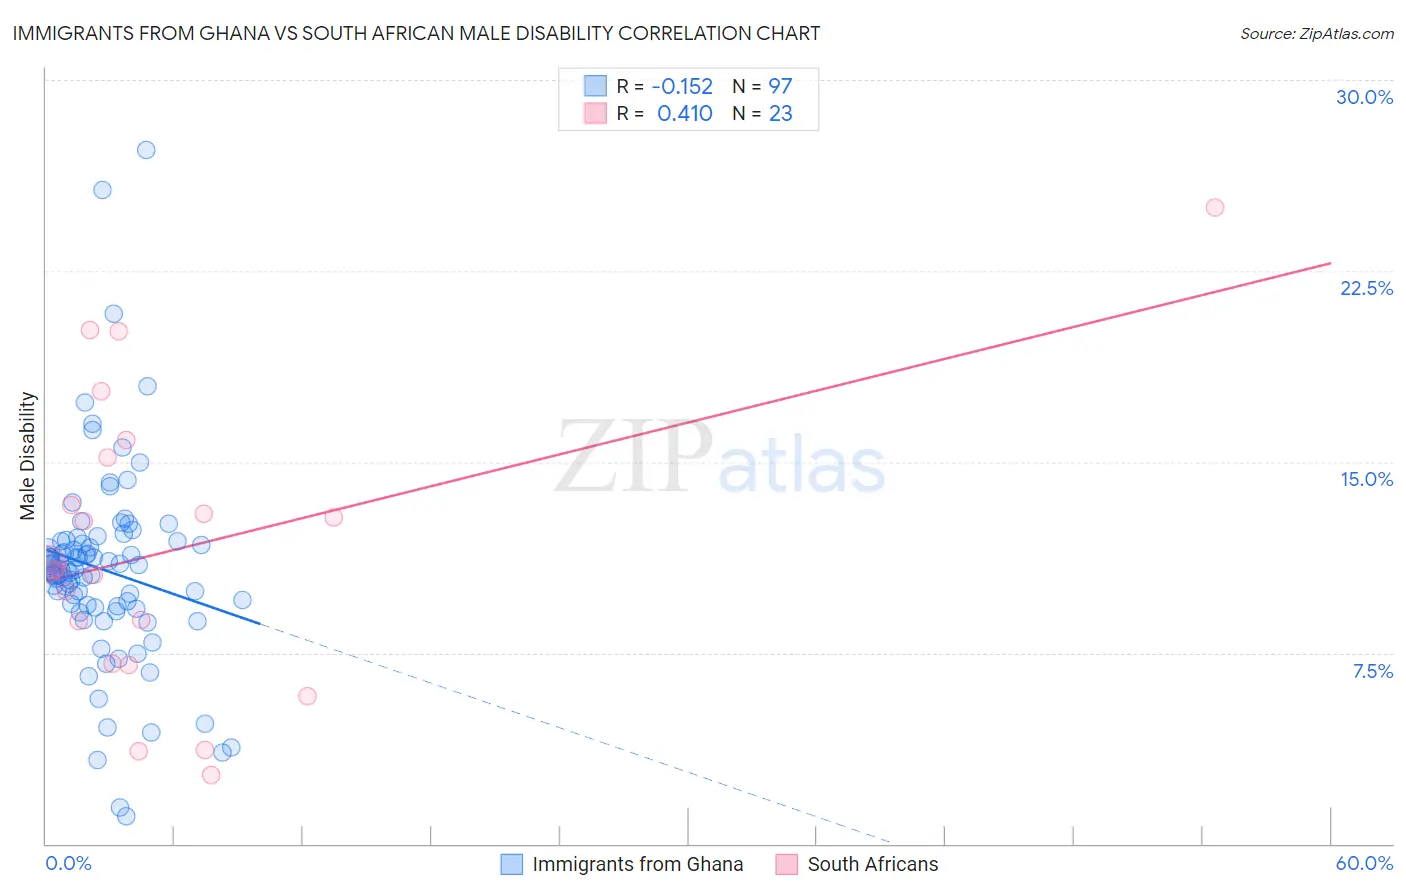
Immigrants from Ghana vs South African Male Disability Correlation Chart
The statistical analysis conducted on geographies consisting of 199,919,905 people shows a poor negative correlation between the proportion of Immigrants from Ghana and percentage of males with a disability in the United States with a correlation coefficient (R) of -0.152 and weighted average of 10.9%. Similarly, the statistical analysis conducted on geographies consisting of 182,590,861 people shows a moderate positive correlation between the proportion of South Africans and percentage of males with a disability in the United States with a correlation coefficient (R) of 0.410 and weighted average of 11.0%, a difference of 0.85%.
Male Disability Correlation Summary
| Measurement | Immigrants from Ghana | South African |
| Minimum | 1.1% | 2.7% |
| Maximum | 27.2% | 25.0% |
| Range | 26.2% | 22.3% |
| Mean | 10.8% | 11.6% |
| Median | 10.8% | 10.8% |
| Interquartile 25% (IQ1) | 9.3% | 7.1% |
| Interquartile 75% (IQ3) | 11.9% | 15.2% |
| Interquartile Range (IQR) | 2.6% | 8.1% |
| Standard Deviation (Sample) | 3.9% | 5.7% |
| Standard Deviation (Population) | 3.9% | 5.5% |
Demographics Similar to Immigrants from Ghana and South Africans by Male Disability
In terms of male disability, the demographic groups most similar to Immigrants from Ghana are Immigrants from South Eastern Asia (10.9%, a difference of 0.010%), Immigrants from Africa (10.9%, a difference of 0.060%), Immigrants from Czechoslovakia (10.9%, a difference of 0.090%), South American Indian (10.9%, a difference of 0.14%), and Immigrants from North Macedonia (10.9%, a difference of 0.14%). Similarly, the demographic groups most similar to South Africans are Nigerian (11.0%, a difference of 0.020%), Immigrants from Italy (11.0%, a difference of 0.020%), Immigrants from Europe (11.0%, a difference of 0.030%), Immigrants from Costa Rica (11.0%, a difference of 0.11%), and Trinidadian and Tobagonian (11.0%, a difference of 0.15%).
| Demographics | Rating | Rank | Male Disability |
| Immigrants | Africa | 89.4 /100 | #120 | Excellent 10.9% |
| Immigrants | South Eastern Asia | 89.2 /100 | #121 | Excellent 10.9% |
| Immigrants | Ghana | 89.0 /100 | #122 | Excellent 10.9% |
| Immigrants | Czechoslovakia | 88.4 /100 | #123 | Excellent 10.9% |
| South American Indians | 88.1 /100 | #124 | Excellent 10.9% |
| Immigrants | North Macedonia | 88.1 /100 | #125 | Excellent 10.9% |
| Immigrants | Trinidad and Tobago | 86.9 /100 | #126 | Excellent 10.9% |
| Immigrants | Ukraine | 86.8 /100 | #127 | Excellent 10.9% |
| Immigrants | Latvia | 85.5 /100 | #128 | Excellent 10.9% |
| Immigrants | Philippines | 85.4 /100 | #129 | Excellent 10.9% |
| Brazilians | 85.4 /100 | #130 | Excellent 10.9% |
| Macedonians | 84.2 /100 | #131 | Excellent 11.0% |
| Immigrants | Fiji | 84.0 /100 | #132 | Excellent 11.0% |
| Ugandans | 83.9 /100 | #133 | Excellent 11.0% |
| Bhutanese | 83.4 /100 | #134 | Excellent 11.0% |
| Trinidadians and Tobagonians | 83.3 /100 | #135 | Excellent 11.0% |
| Immigrants | Costa Rica | 82.8 /100 | #136 | Excellent 11.0% |
| Immigrants | Europe | 82.0 /100 | #137 | Excellent 11.0% |
| Nigerians | 81.9 /100 | #138 | Excellent 11.0% |
| South Africans | 81.7 /100 | #139 | Excellent 11.0% |
| Immigrants | Italy | 81.5 /100 | #140 | Excellent 11.0% |