Immigrants from Fiji vs Kiowa Disability Age Under 5
COMPARE
Immigrants from Fiji
Kiowa
Disability Age Under 5
Disability Age Under 5 Comparison
Immigrants from Fiji
Kiowa
0.92%
DISABILITY AGE UNDER 5
100.0/ 100
METRIC RATING
9th/ 347
METRIC RANK
1.5%
DISABILITY AGE UNDER 5
0.0/ 100
METRIC RATING
278th/ 347
METRIC RANK
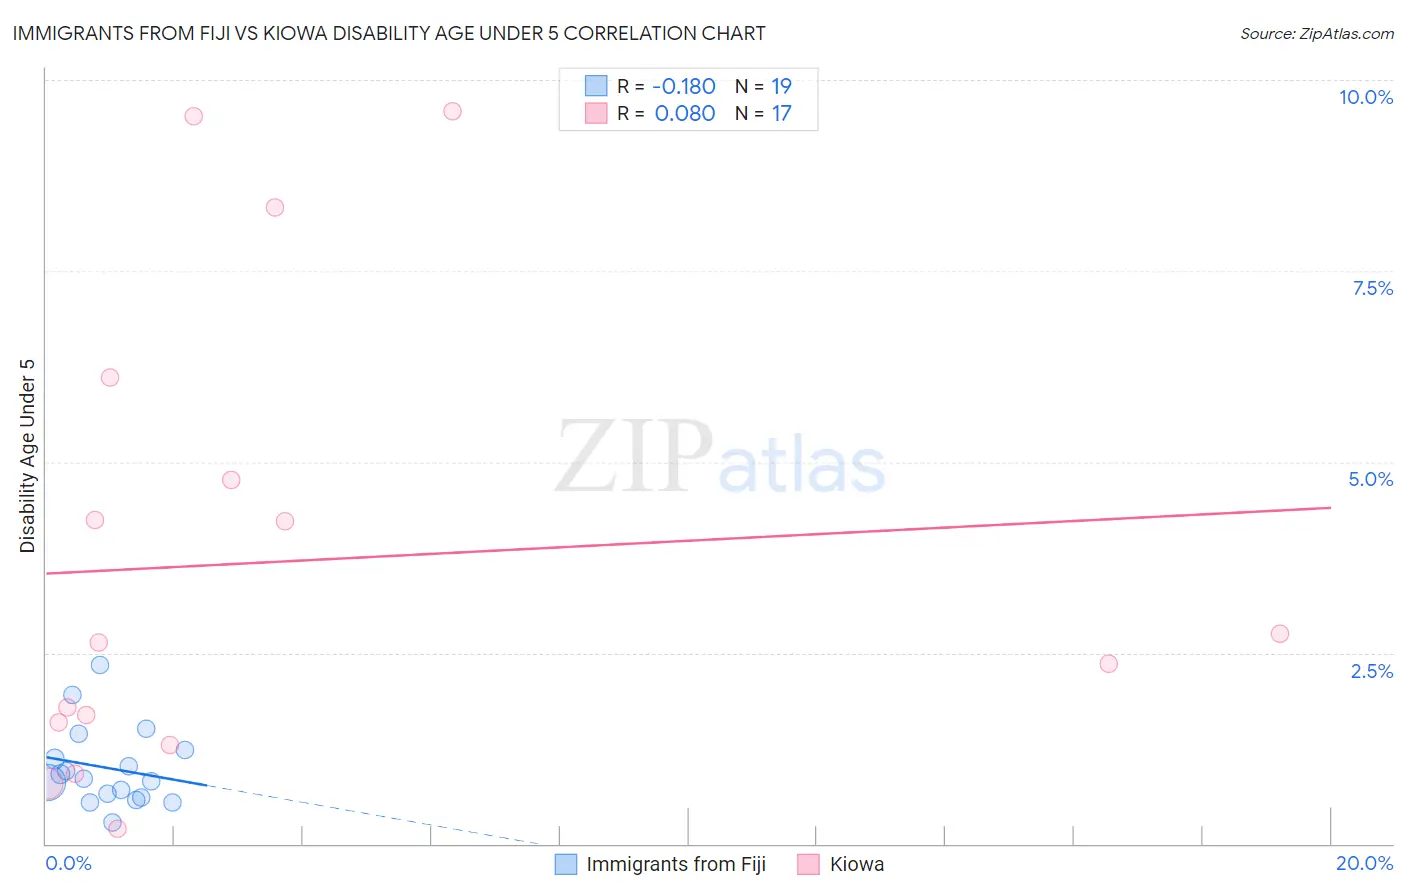
Immigrants from Fiji vs Kiowa Disability Age Under 5 Correlation Chart
The statistical analysis conducted on geographies consisting of 74,961,112 people shows a poor negative correlation between the proportion of Immigrants from Fiji and percentage of population with a disability under the age of 5 in the United States with a correlation coefficient (R) of -0.180 and weighted average of 0.92%. Similarly, the statistical analysis conducted on geographies consisting of 48,964,732 people shows a slight positive correlation between the proportion of Kiowa and percentage of population with a disability under the age of 5 in the United States with a correlation coefficient (R) of 0.080 and weighted average of 1.5%, a difference of 60.9%.
Disability Age Under 5 Correlation Summary
| Measurement | Immigrants from Fiji | Kiowa |
| Minimum | 0.28% | 0.20% |
| Maximum | 2.3% | 9.6% |
| Range | 2.1% | 9.4% |
| Mean | 0.99% | 3.7% |
| Median | 0.85% | 2.6% |
| Interquartile 25% (IQ1) | 0.60% | 1.4% |
| Interquartile 75% (IQ3) | 1.2% | 5.4% |
| Interquartile Range (IQR) | 0.62% | 4.0% |
| Standard Deviation (Sample) | 0.52% | 3.0% |
| Standard Deviation (Population) | 0.50% | 2.9% |
Similar Demographics by Disability Age Under 5
Demographics Similar to Immigrants from Fiji by Disability Age Under 5
In terms of disability age under 5, the demographic groups most similar to Immigrants from Fiji are Immigrants from Yemen (0.91%, a difference of 1.1%), Immigrants from Afghanistan (0.91%, a difference of 1.2%), Marshallese (0.94%, a difference of 2.1%), Afghan (0.94%, a difference of 2.9%), and Immigrants from Grenada (0.94%, a difference of 2.9%).
| Demographics | Rating | Rank | Disability Age Under 5 |
| Immigrants | St. Vincent and the Grenadines | 100.0 /100 | #2 | Exceptional 0.79% |
| Vietnamese | 100.0 /100 | #3 | Exceptional 0.81% |
| Immigrants | Uzbekistan | 100.0 /100 | #4 | Exceptional 0.85% |
| Immigrants | Bangladesh | 100.0 /100 | #5 | Exceptional 0.85% |
| Ute | 100.0 /100 | #6 | Exceptional 0.86% |
| Immigrants | Afghanistan | 100.0 /100 | #7 | Exceptional 0.91% |
| Immigrants | Yemen | 100.0 /100 | #8 | Exceptional 0.91% |
| Immigrants | Fiji | 100.0 /100 | #9 | Exceptional 0.92% |
| Marshallese | 100.0 /100 | #10 | Exceptional 0.94% |
| Afghans | 100.0 /100 | #11 | Exceptional 0.94% |
| Immigrants | Grenada | 100.0 /100 | #12 | Exceptional 0.94% |
| Soviet Union | 100.0 /100 | #13 | Exceptional 0.95% |
| Yuman | 100.0 /100 | #14 | Exceptional 0.95% |
| Immigrants | Hong Kong | 100.0 /100 | #15 | Exceptional 0.95% |
| Immigrants | Israel | 100.0 /100 | #16 | Exceptional 0.96% |
Demographics Similar to Kiowa by Disability Age Under 5
In terms of disability age under 5, the demographic groups most similar to Kiowa are Danish (1.5%, a difference of 0.010%), Canadian (1.5%, a difference of 0.080%), British (1.5%, a difference of 0.77%), Greek (1.5%, a difference of 0.78%), and Brazilian (1.5%, a difference of 1.4%).
| Demographics | Rating | Rank | Disability Age Under 5 |
| Immigrants | Canada | 0.1 /100 | #271 | Tragic 1.4% |
| Blacks/African Americans | 0.1 /100 | #272 | Tragic 1.4% |
| Alaskan Athabascans | 0.1 /100 | #273 | Tragic 1.5% |
| Iroquois | 0.0 /100 | #274 | Tragic 1.5% |
| Brazilians | 0.0 /100 | #275 | Tragic 1.5% |
| Greeks | 0.0 /100 | #276 | Tragic 1.5% |
| Canadians | 0.0 /100 | #277 | Tragic 1.5% |
| Kiowa | 0.0 /100 | #278 | Tragic 1.5% |
| Danes | 0.0 /100 | #279 | Tragic 1.5% |
| British | 0.0 /100 | #280 | Tragic 1.5% |
| Czechoslovakians | 0.0 /100 | #281 | Tragic 1.5% |
| Cheyenne | 0.0 /100 | #282 | Tragic 1.5% |
| Delaware | 0.0 /100 | #283 | Tragic 1.5% |
| Europeans | 0.0 /100 | #284 | Tragic 1.5% |
| Croatians | 0.0 /100 | #285 | Tragic 1.5% |