Immigrants from Dominica vs Kiowa Disability Age Under 5
COMPARE
Immigrants from Dominica
Kiowa
Disability Age Under 5
Disability Age Under 5 Comparison
Immigrants from Dominica
Kiowa
1.4%
DISABILITY AGE UNDER 5
0.2/ 100
METRIC RATING
262nd/ 347
METRIC RANK
1.5%
DISABILITY AGE UNDER 5
0.0/ 100
METRIC RATING
278th/ 347
METRIC RANK
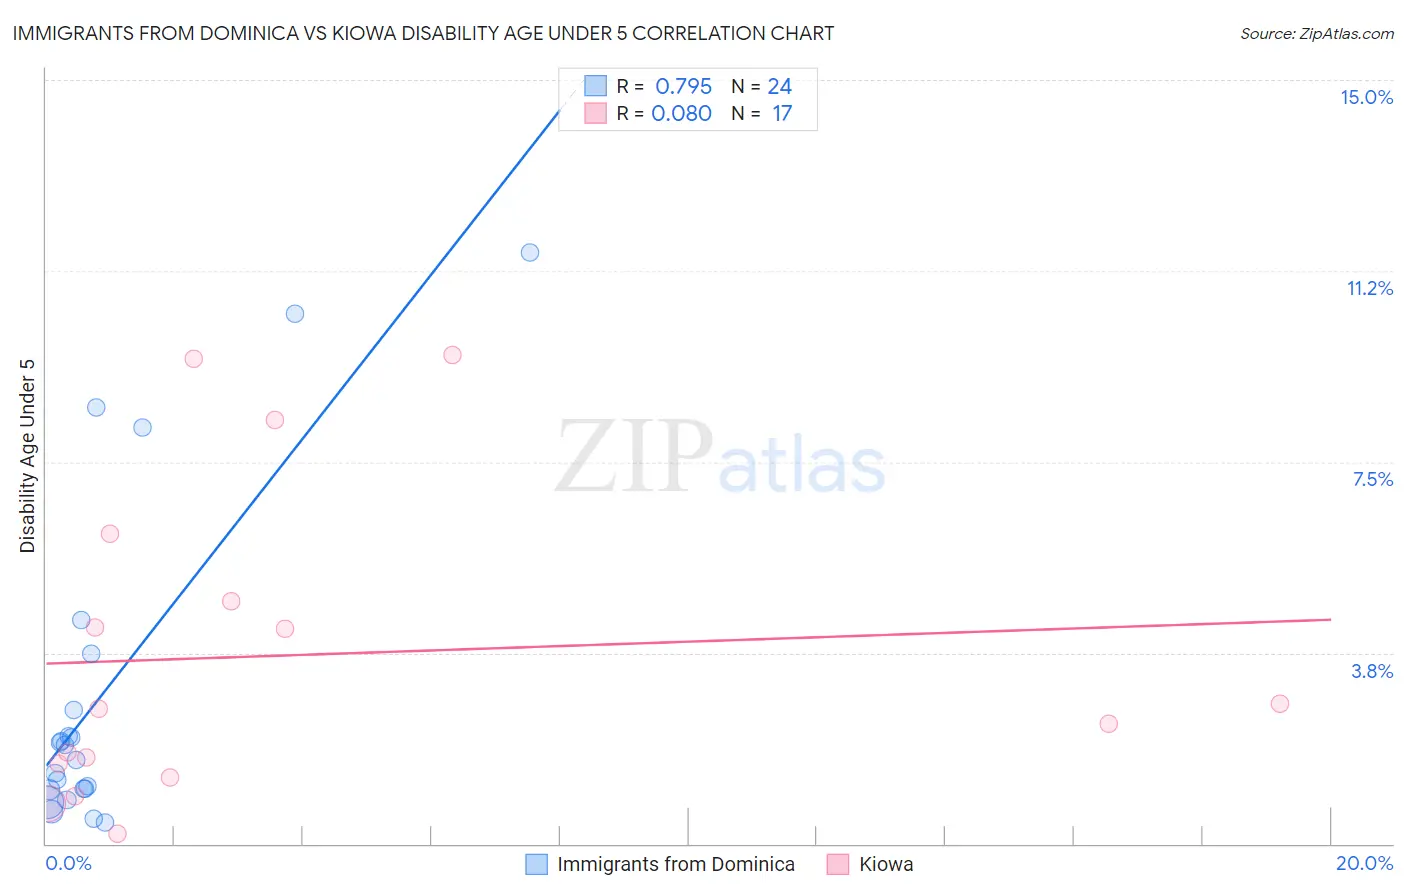
Immigrants from Dominica vs Kiowa Disability Age Under 5 Correlation Chart
The statistical analysis conducted on geographies consisting of 63,480,802 people shows a strong positive correlation between the proportion of Immigrants from Dominica and percentage of population with a disability under the age of 5 in the United States with a correlation coefficient (R) of 0.795 and weighted average of 1.4%. Similarly, the statistical analysis conducted on geographies consisting of 48,964,732 people shows a slight positive correlation between the proportion of Kiowa and percentage of population with a disability under the age of 5 in the United States with a correlation coefficient (R) of 0.080 and weighted average of 1.5%, a difference of 4.0%.
Disability Age Under 5 Correlation Summary
| Measurement | Immigrants from Dominica | Kiowa |
| Minimum | 0.41% | 0.20% |
| Maximum | 11.6% | 9.6% |
| Range | 11.2% | 9.4% |
| Mean | 3.0% | 3.7% |
| Median | 1.8% | 2.6% |
| Interquartile 25% (IQ1) | 1.1% | 1.4% |
| Interquartile 75% (IQ3) | 3.2% | 5.4% |
| Interquartile Range (IQR) | 2.1% | 4.0% |
| Standard Deviation (Sample) | 3.3% | 3.0% |
| Standard Deviation (Population) | 3.2% | 2.9% |
Demographics Similar to Immigrants from Dominica and Kiowa by Disability Age Under 5
In terms of disability age under 5, the demographic groups most similar to Immigrants from Dominica are Spanish (1.4%, a difference of 0.060%), Immigrants from Netherlands (1.4%, a difference of 0.16%), Yugoslavian (1.4%, a difference of 0.21%), Carpatho Rusyn (1.4%, a difference of 0.25%), and Immigrants from Germany (1.4%, a difference of 0.28%). Similarly, the demographic groups most similar to Kiowa are Danish (1.5%, a difference of 0.010%), Canadian (1.5%, a difference of 0.080%), British (1.5%, a difference of 0.77%), Greek (1.5%, a difference of 0.78%), and Brazilian (1.5%, a difference of 1.4%).
| Demographics | Rating | Rank | Disability Age Under 5 |
| Slavs | 0.3 /100 | #260 | Tragic 1.4% |
| Immigrants | Netherlands | 0.2 /100 | #261 | Tragic 1.4% |
| Immigrants | Dominica | 0.2 /100 | #262 | Tragic 1.4% |
| Spanish | 0.2 /100 | #263 | Tragic 1.4% |
| Yugoslavians | 0.1 /100 | #264 | Tragic 1.4% |
| Carpatho Rusyns | 0.1 /100 | #265 | Tragic 1.4% |
| Immigrants | Germany | 0.1 /100 | #266 | Tragic 1.4% |
| Cree | 0.1 /100 | #267 | Tragic 1.4% |
| Belgians | 0.1 /100 | #268 | Tragic 1.4% |
| Austrians | 0.1 /100 | #269 | Tragic 1.4% |
| Immigrants | North America | 0.1 /100 | #270 | Tragic 1.4% |
| Immigrants | Canada | 0.1 /100 | #271 | Tragic 1.4% |
| Blacks/African Americans | 0.1 /100 | #272 | Tragic 1.4% |
| Alaskan Athabascans | 0.1 /100 | #273 | Tragic 1.5% |
| Iroquois | 0.0 /100 | #274 | Tragic 1.5% |
| Brazilians | 0.0 /100 | #275 | Tragic 1.5% |
| Greeks | 0.0 /100 | #276 | Tragic 1.5% |
| Canadians | 0.0 /100 | #277 | Tragic 1.5% |
| Kiowa | 0.0 /100 | #278 | Tragic 1.5% |
| Danes | 0.0 /100 | #279 | Tragic 1.5% |
| British | 0.0 /100 | #280 | Tragic 1.5% |