Immigrants from Fiji vs Argentinean Disability Age Under 5
COMPARE
Immigrants from Fiji
Argentinean
Disability Age Under 5
Disability Age Under 5 Comparison
Immigrants from Fiji
Argentineans
0.92%
DISABILITY AGE UNDER 5
100.0/ 100
METRIC RATING
9th/ 347
METRIC RANK
1.2%
DISABILITY AGE UNDER 5
85.7/ 100
METRIC RATING
134th/ 347
METRIC RANK
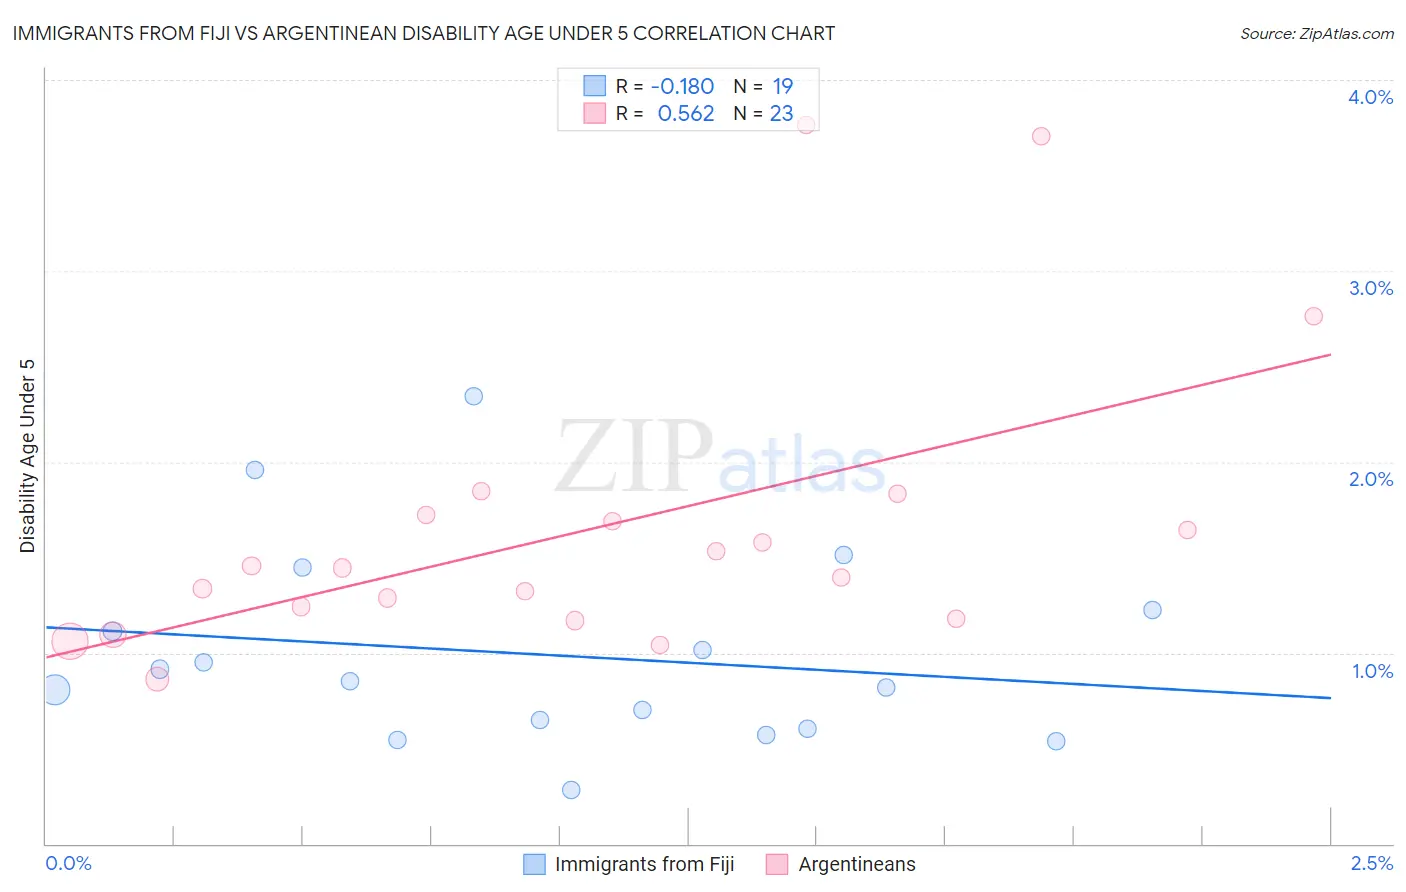
Immigrants from Fiji vs Argentinean Disability Age Under 5 Correlation Chart
The statistical analysis conducted on geographies consisting of 74,961,112 people shows a poor negative correlation between the proportion of Immigrants from Fiji and percentage of population with a disability under the age of 5 in the United States with a correlation coefficient (R) of -0.180 and weighted average of 0.92%. Similarly, the statistical analysis conducted on geographies consisting of 177,264,902 people shows a substantial positive correlation between the proportion of Argentineans and percentage of population with a disability under the age of 5 in the United States with a correlation coefficient (R) of 0.562 and weighted average of 1.2%, a difference of 29.7%.
Disability Age Under 5 Correlation Summary
| Measurement | Immigrants from Fiji | Argentinean |
| Minimum | 0.28% | 0.86% |
| Maximum | 2.3% | 3.8% |
| Range | 2.1% | 2.9% |
| Mean | 0.99% | 1.7% |
| Median | 0.85% | 1.4% |
| Interquartile 25% (IQ1) | 0.60% | 1.2% |
| Interquartile 75% (IQ3) | 1.2% | 1.7% |
| Interquartile Range (IQR) | 0.62% | 0.55% |
| Standard Deviation (Sample) | 0.52% | 0.76% |
| Standard Deviation (Population) | 0.50% | 0.75% |
Similar Demographics by Disability Age Under 5
Demographics Similar to Immigrants from Fiji by Disability Age Under 5
In terms of disability age under 5, the demographic groups most similar to Immigrants from Fiji are Immigrants from Yemen (0.91%, a difference of 1.1%), Immigrants from Afghanistan (0.91%, a difference of 1.2%), Marshallese (0.94%, a difference of 2.1%), Afghan (0.94%, a difference of 2.9%), and Immigrants from Grenada (0.94%, a difference of 2.9%).
| Demographics | Rating | Rank | Disability Age Under 5 |
| Immigrants | St. Vincent and the Grenadines | 100.0 /100 | #2 | Exceptional 0.79% |
| Vietnamese | 100.0 /100 | #3 | Exceptional 0.81% |
| Immigrants | Uzbekistan | 100.0 /100 | #4 | Exceptional 0.85% |
| Immigrants | Bangladesh | 100.0 /100 | #5 | Exceptional 0.85% |
| Ute | 100.0 /100 | #6 | Exceptional 0.86% |
| Immigrants | Afghanistan | 100.0 /100 | #7 | Exceptional 0.91% |
| Immigrants | Yemen | 100.0 /100 | #8 | Exceptional 0.91% |
| Immigrants | Fiji | 100.0 /100 | #9 | Exceptional 0.92% |
| Marshallese | 100.0 /100 | #10 | Exceptional 0.94% |
| Afghans | 100.0 /100 | #11 | Exceptional 0.94% |
| Immigrants | Grenada | 100.0 /100 | #12 | Exceptional 0.94% |
| Soviet Union | 100.0 /100 | #13 | Exceptional 0.95% |
| Yuman | 100.0 /100 | #14 | Exceptional 0.95% |
| Immigrants | Hong Kong | 100.0 /100 | #15 | Exceptional 0.95% |
| Immigrants | Israel | 100.0 /100 | #16 | Exceptional 0.96% |
Demographics Similar to Argentineans by Disability Age Under 5
In terms of disability age under 5, the demographic groups most similar to Argentineans are Immigrants from Spain (1.2%, a difference of 0.16%), Fijian (1.2%, a difference of 0.20%), Immigrants from Eastern Europe (1.2%, a difference of 0.31%), Immigrants from Serbia (1.2%, a difference of 0.38%), and Moroccan (1.2%, a difference of 0.38%).
| Demographics | Rating | Rank | Disability Age Under 5 |
| Immigrants | Romania | 88.4 /100 | #127 | Excellent 1.2% |
| Immigrants | France | 88.4 /100 | #128 | Excellent 1.2% |
| Immigrants | Immigrants | 88.0 /100 | #129 | Excellent 1.2% |
| Koreans | 87.7 /100 | #130 | Excellent 1.2% |
| Immigrants | Serbia | 87.6 /100 | #131 | Excellent 1.2% |
| Immigrants | Eastern Europe | 87.3 /100 | #132 | Excellent 1.2% |
| Immigrants | Spain | 86.5 /100 | #133 | Excellent 1.2% |
| Argentineans | 85.7 /100 | #134 | Excellent 1.2% |
| Fijians | 84.7 /100 | #135 | Excellent 1.2% |
| Moroccans | 83.6 /100 | #136 | Excellent 1.2% |
| Immigrants | Eastern Africa | 83.1 /100 | #137 | Excellent 1.2% |
| Immigrants | Czechoslovakia | 82.8 /100 | #138 | Excellent 1.2% |
| New Zealanders | 81.4 /100 | #139 | Excellent 1.2% |
| Somalis | 80.8 /100 | #140 | Excellent 1.2% |
| Immigrants | Honduras | 80.4 /100 | #141 | Excellent 1.2% |