Immigrants from Fiji vs Kiowa Unemployment
COMPARE
Immigrants from Fiji
Kiowa
Unemployment
Unemployment Comparison
Immigrants from Fiji
Kiowa
5.9%
UNEMPLOYMENT
0.0/ 100
METRIC RATING
273rd/ 347
METRIC RANK
5.7%
UNEMPLOYMENT
0.6/ 100
METRIC RATING
251st/ 347
METRIC RANK
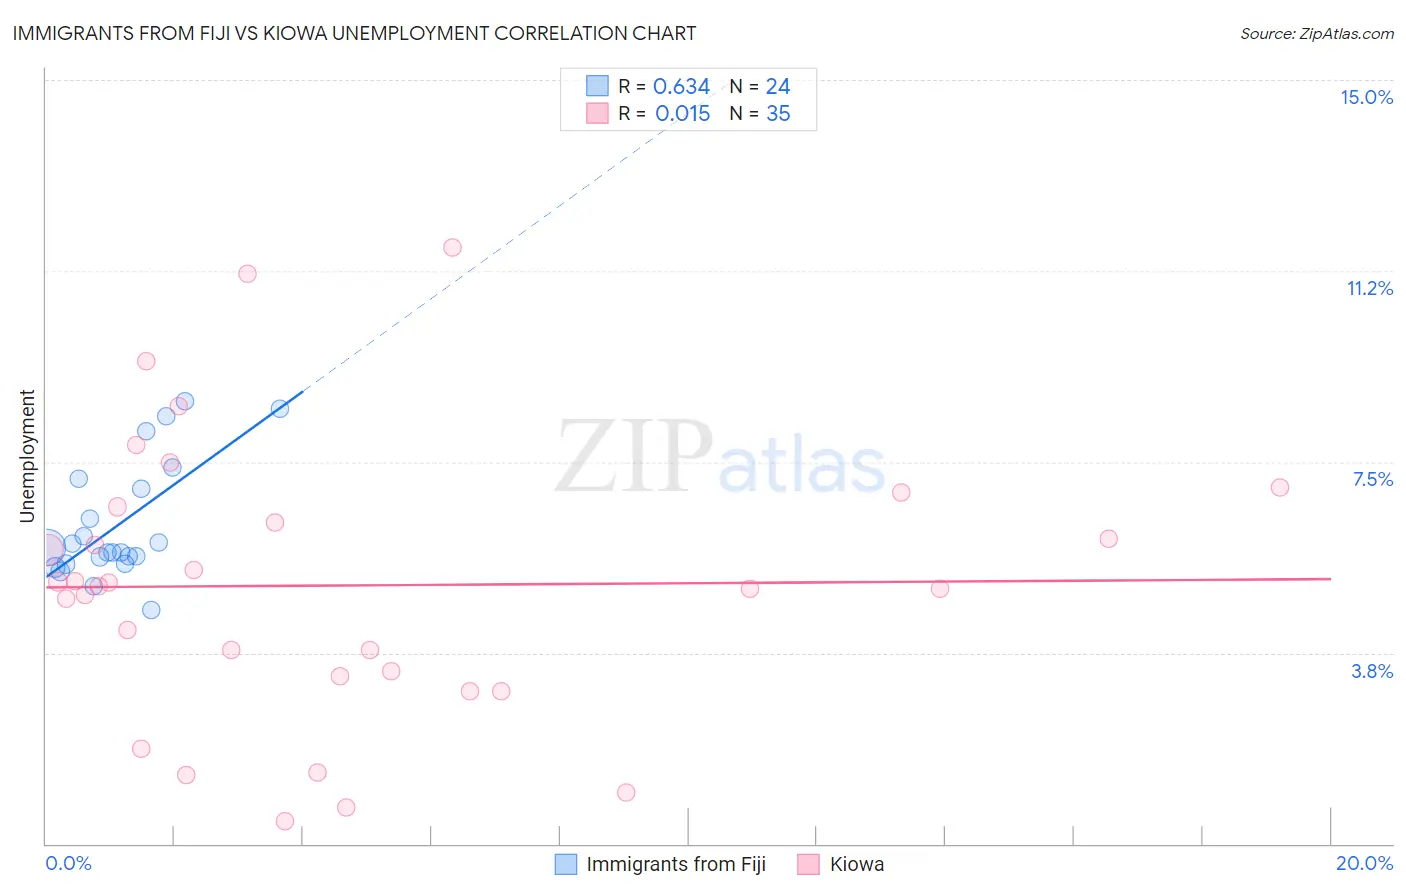
Immigrants from Fiji vs Kiowa Unemployment Correlation Chart
The statistical analysis conducted on geographies consisting of 93,754,040 people shows a significant positive correlation between the proportion of Immigrants from Fiji and unemployment in the United States with a correlation coefficient (R) of 0.634 and weighted average of 5.9%. Similarly, the statistical analysis conducted on geographies consisting of 56,085,771 people shows no correlation between the proportion of Kiowa and unemployment in the United States with a correlation coefficient (R) of 0.015 and weighted average of 5.7%, a difference of 4.1%.
Unemployment Correlation Summary
| Measurement | Immigrants from Fiji | Kiowa |
| Minimum | 4.6% | 0.44% |
| Maximum | 8.7% | 11.7% |
| Range | 4.1% | 11.3% |
| Mean | 6.3% | 5.1% |
| Median | 5.8% | 5.1% |
| Interquartile 25% (IQ1) | 5.6% | 3.3% |
| Interquartile 75% (IQ3) | 7.1% | 6.6% |
| Interquartile Range (IQR) | 1.5% | 3.3% |
| Standard Deviation (Sample) | 1.2% | 2.7% |
| Standard Deviation (Population) | 1.1% | 2.7% |
Similar Demographics by Unemployment
Demographics Similar to Immigrants from Fiji by Unemployment
In terms of unemployment, the demographic groups most similar to Immigrants from Fiji are Hispanic or Latino (5.9%, a difference of 0.17%), Bahamian (5.9%, a difference of 0.29%), Immigrants from Latin America (5.9%, a difference of 0.50%), Immigrants from Central America (6.0%, a difference of 0.78%), and Mexican (5.9%, a difference of 0.85%).
| Demographics | Rating | Rank | Unemployment |
| Mexican American Indians | 0.1 /100 | #266 | Tragic 5.8% |
| Immigrants | Nigeria | 0.1 /100 | #267 | Tragic 5.8% |
| Immigrants | Sierra Leone | 0.1 /100 | #268 | Tragic 5.8% |
| Immigrants | El Salvador | 0.1 /100 | #269 | Tragic 5.8% |
| Blackfeet | 0.1 /100 | #270 | Tragic 5.8% |
| Mexicans | 0.1 /100 | #271 | Tragic 5.9% |
| Hispanics or Latinos | 0.0 /100 | #272 | Tragic 5.9% |
| Immigrants | Fiji | 0.0 /100 | #273 | Tragic 5.9% |
| Bahamians | 0.0 /100 | #274 | Tragic 5.9% |
| Immigrants | Latin America | 0.0 /100 | #275 | Tragic 5.9% |
| Immigrants | Central America | 0.0 /100 | #276 | Tragic 6.0% |
| Armenians | 0.0 /100 | #277 | Tragic 6.0% |
| Ghanaians | 0.0 /100 | #278 | Tragic 6.0% |
| Immigrants | Mexico | 0.0 /100 | #279 | Tragic 6.0% |
| Immigrants | Western Africa | 0.0 /100 | #280 | Tragic 6.0% |
Demographics Similar to Kiowa by Unemployment
In terms of unemployment, the demographic groups most similar to Kiowa are Japanese (5.6%, a difference of 0.47%), Cajun (5.6%, a difference of 0.48%), Liberian (5.6%, a difference of 0.74%), Honduran (5.7%, a difference of 0.74%), and Central American (5.7%, a difference of 0.75%).
| Demographics | Rating | Rank | Unemployment |
| Dutch West Indians | 1.2 /100 | #244 | Tragic 5.6% |
| French American Indians | 1.2 /100 | #245 | Tragic 5.6% |
| Bermudans | 1.1 /100 | #246 | Tragic 5.6% |
| Immigrants | Cameroon | 1.0 /100 | #247 | Tragic 5.6% |
| Liberians | 0.9 /100 | #248 | Tragic 5.6% |
| Cajuns | 0.8 /100 | #249 | Tragic 5.6% |
| Japanese | 0.8 /100 | #250 | Tragic 5.6% |
| Kiowa | 0.6 /100 | #251 | Tragic 5.7% |
| Hondurans | 0.3 /100 | #252 | Tragic 5.7% |
| Central Americans | 0.3 /100 | #253 | Tragic 5.7% |
| Immigrants | Honduras | 0.3 /100 | #254 | Tragic 5.7% |
| Immigrants | Portugal | 0.2 /100 | #255 | Tragic 5.7% |
| Guatemalans | 0.2 /100 | #256 | Tragic 5.8% |
| Yaqui | 0.2 /100 | #257 | Tragic 5.8% |
| Immigrants | Bahamas | 0.1 /100 | #258 | Tragic 5.8% |