Immigrants from Fiji vs Puget Sound Salish Disability Age Under 5
COMPARE
Immigrants from Fiji
Puget Sound Salish
Disability Age Under 5
Disability Age Under 5 Comparison
Immigrants from Fiji
Puget Sound Salish
0.92%
DISABILITY AGE UNDER 5
100.0/ 100
METRIC RATING
9th/ 347
METRIC RANK
0.97%
DISABILITY AGE UNDER 5
100.0/ 100
METRIC RATING
19th/ 347
METRIC RANK
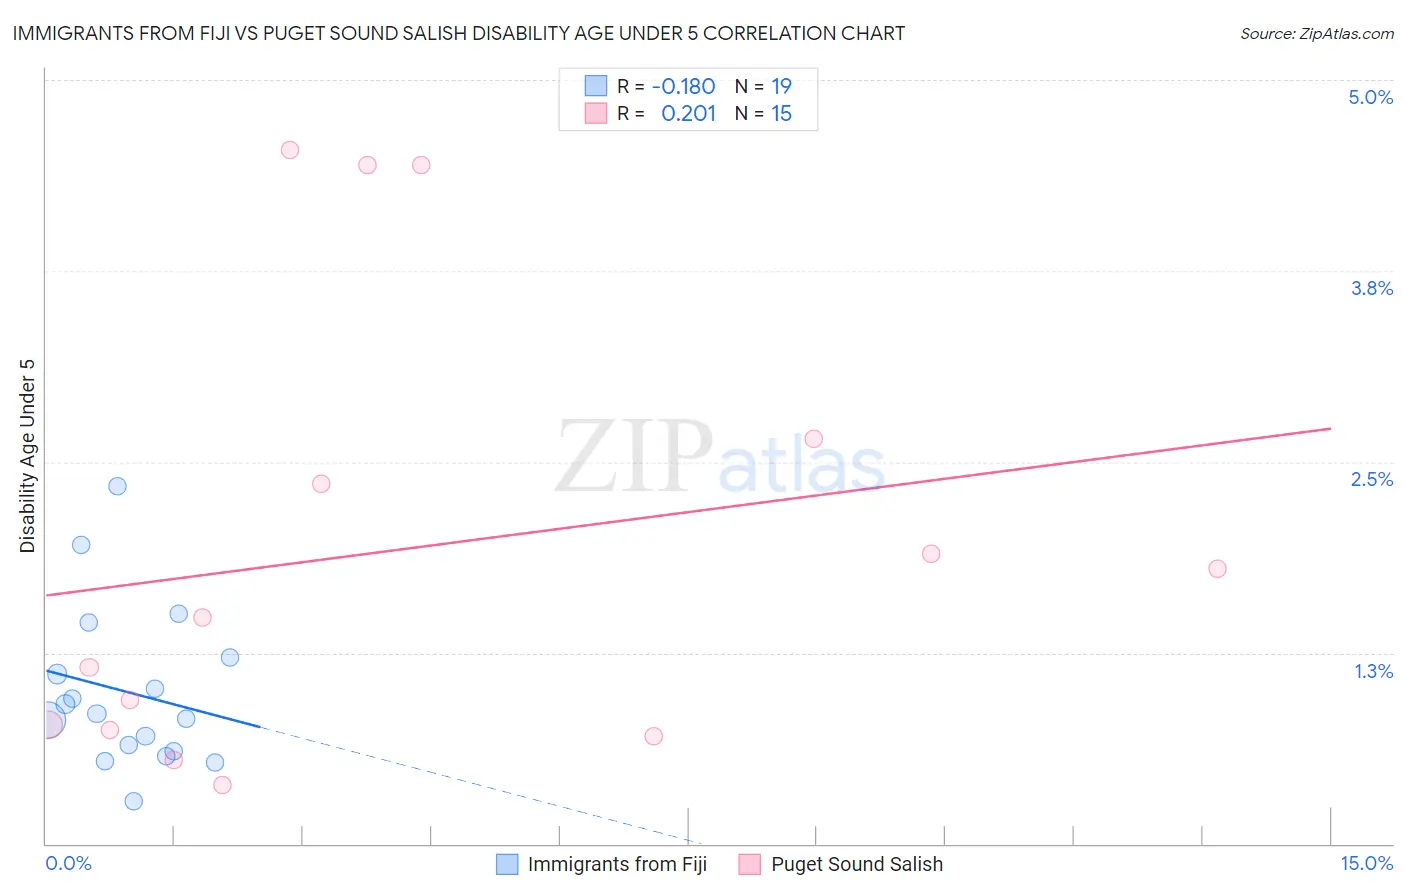
Immigrants from Fiji vs Puget Sound Salish Disability Age Under 5 Correlation Chart
The statistical analysis conducted on geographies consisting of 74,961,112 people shows a poor negative correlation between the proportion of Immigrants from Fiji and percentage of population with a disability under the age of 5 in the United States with a correlation coefficient (R) of -0.180 and weighted average of 0.92%. Similarly, the statistical analysis conducted on geographies consisting of 36,173,931 people shows a weak positive correlation between the proportion of Puget Sound Salish and percentage of population with a disability under the age of 5 in the United States with a correlation coefficient (R) of 0.201 and weighted average of 0.97%, a difference of 6.0%.
Disability Age Under 5 Correlation Summary
| Measurement | Immigrants from Fiji | Puget Sound Salish |
| Minimum | 0.28% | 0.38% |
| Maximum | 2.3% | 4.5% |
| Range | 2.1% | 4.2% |
| Mean | 0.99% | 1.9% |
| Median | 0.85% | 1.5% |
| Interquartile 25% (IQ1) | 0.60% | 0.75% |
| Interquartile 75% (IQ3) | 1.2% | 2.7% |
| Interquartile Range (IQR) | 0.62% | 1.9% |
| Standard Deviation (Sample) | 0.52% | 1.5% |
| Standard Deviation (Population) | 0.50% | 1.4% |
Demographics Similar to Immigrants from Fiji and Puget Sound Salish by Disability Age Under 5
In terms of disability age under 5, the demographic groups most similar to Immigrants from Fiji are Immigrants from Yemen (0.91%, a difference of 1.1%), Immigrants from Afghanistan (0.91%, a difference of 1.2%), Marshallese (0.94%, a difference of 2.1%), Afghan (0.94%, a difference of 2.9%), and Immigrants from Grenada (0.94%, a difference of 2.9%). Similarly, the demographic groups most similar to Puget Sound Salish are Nepalese (0.97%, a difference of 0.10%), Immigrants from Barbados (0.97%, a difference of 0.37%), Immigrants from China (0.96%, a difference of 0.95%), Immigrants from Israel (0.96%, a difference of 1.4%), and British West Indian (0.99%, a difference of 1.9%).
| Demographics | Rating | Rank | Disability Age Under 5 |
| Immigrants | Uzbekistan | 100.0 /100 | #4 | Exceptional 0.85% |
| Immigrants | Bangladesh | 100.0 /100 | #5 | Exceptional 0.85% |
| Ute | 100.0 /100 | #6 | Exceptional 0.86% |
| Immigrants | Afghanistan | 100.0 /100 | #7 | Exceptional 0.91% |
| Immigrants | Yemen | 100.0 /100 | #8 | Exceptional 0.91% |
| Immigrants | Fiji | 100.0 /100 | #9 | Exceptional 0.92% |
| Marshallese | 100.0 /100 | #10 | Exceptional 0.94% |
| Afghans | 100.0 /100 | #11 | Exceptional 0.94% |
| Immigrants | Grenada | 100.0 /100 | #12 | Exceptional 0.94% |
| Soviet Union | 100.0 /100 | #13 | Exceptional 0.95% |
| Yuman | 100.0 /100 | #14 | Exceptional 0.95% |
| Immigrants | Hong Kong | 100.0 /100 | #15 | Exceptional 0.95% |
| Immigrants | Israel | 100.0 /100 | #16 | Exceptional 0.96% |
| Immigrants | China | 100.0 /100 | #17 | Exceptional 0.96% |
| Immigrants | Barbados | 100.0 /100 | #18 | Exceptional 0.97% |
| Puget Sound Salish | 100.0 /100 | #19 | Exceptional 0.97% |
| Nepalese | 100.0 /100 | #20 | Exceptional 0.97% |
| British West Indians | 100.0 /100 | #21 | Exceptional 0.99% |
| Immigrants | Iran | 100.0 /100 | #22 | Exceptional 1.00% |
| Yakama | 100.0 /100 | #23 | Exceptional 1.00% |
| Indians (Asian) | 100.0 /100 | #24 | Exceptional 1.0% |