Immigrants from Eritrea vs Immigrants from Dominica Hearing Disability
COMPARE
Immigrants from Eritrea
Immigrants from Dominica
Hearing Disability
Hearing Disability Comparison
Immigrants from Eritrea
Immigrants from Dominica
2.7%
HEARING DISABILITY
98.5/ 100
METRIC RATING
59th/ 347
METRIC RANK
2.6%
HEARING DISABILITY
99.3/ 100
METRIC RATING
46th/ 347
METRIC RANK
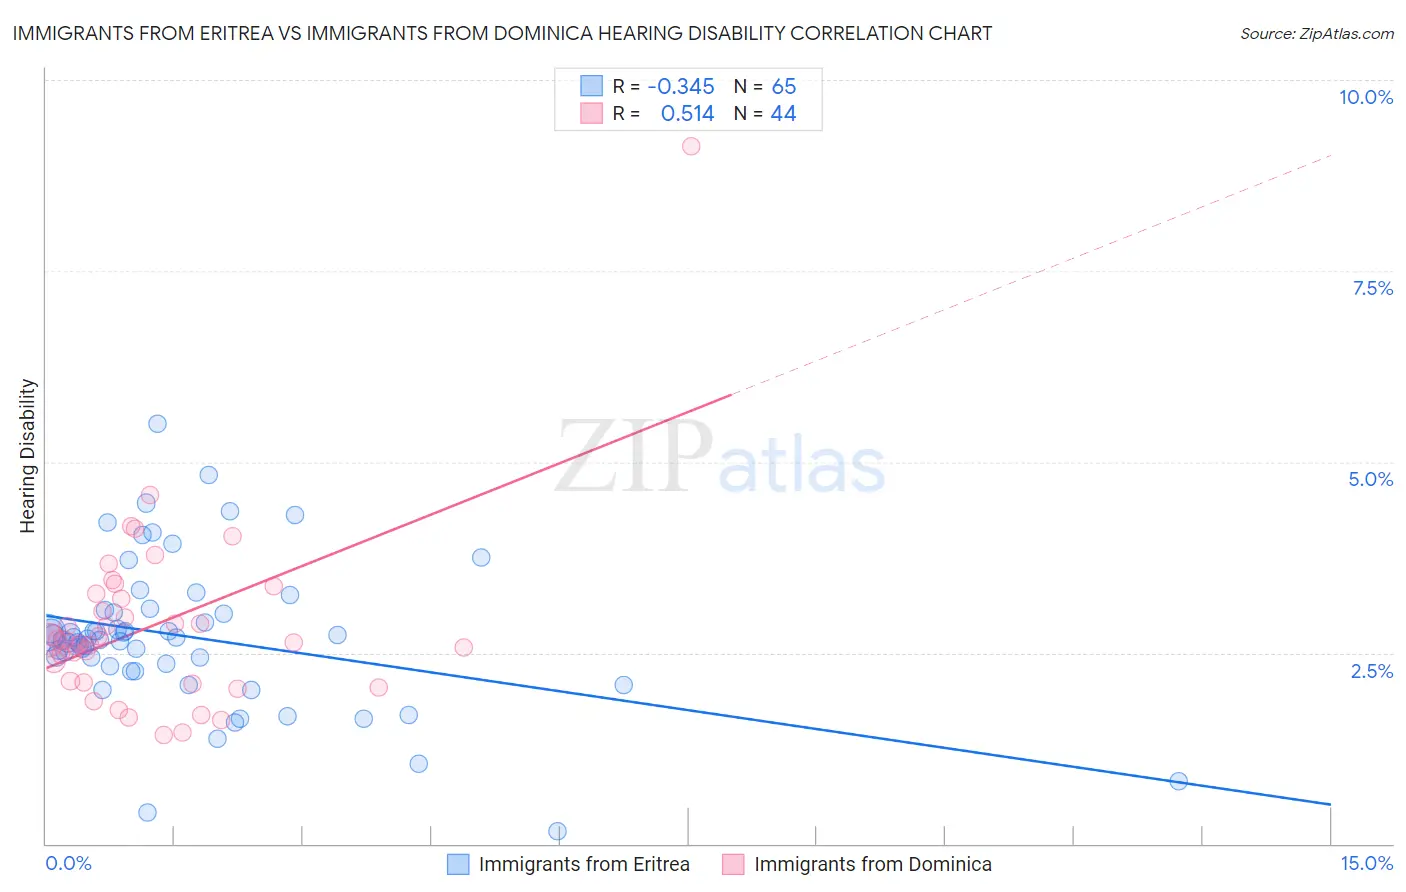
Immigrants from Eritrea vs Immigrants from Dominica Hearing Disability Correlation Chart
The statistical analysis conducted on geographies consisting of 104,850,181 people shows a mild negative correlation between the proportion of Immigrants from Eritrea and percentage of population with hearing disability in the United States with a correlation coefficient (R) of -0.345 and weighted average of 2.7%. Similarly, the statistical analysis conducted on geographies consisting of 83,776,076 people shows a substantial positive correlation between the proportion of Immigrants from Dominica and percentage of population with hearing disability in the United States with a correlation coefficient (R) of 0.514 and weighted average of 2.6%, a difference of 2.1%.
Hearing Disability Correlation Summary
| Measurement | Immigrants from Eritrea | Immigrants from Dominica |
| Minimum | 0.17% | 1.4% |
| Maximum | 5.5% | 9.1% |
| Range | 5.3% | 7.7% |
| Mean | 2.7% | 2.9% |
| Median | 2.7% | 2.7% |
| Interquartile 25% (IQ1) | 2.3% | 2.1% |
| Interquartile 75% (IQ3) | 3.0% | 3.2% |
| Interquartile Range (IQR) | 0.75% | 1.1% |
| Standard Deviation (Sample) | 0.97% | 1.2% |
| Standard Deviation (Population) | 0.96% | 1.2% |
Demographics Similar to Immigrants from Eritrea and Immigrants from Dominica by Hearing Disability
In terms of hearing disability, the demographic groups most similar to Immigrants from Eritrea are Immigrants from Egypt (2.7%, a difference of 0.070%), Immigrants from Peru (2.7%, a difference of 0.11%), Immigrants from Uzbekistan (2.7%, a difference of 0.20%), Immigrants from Colombia (2.7%, a difference of 0.21%), and South American (2.7%, a difference of 0.88%). Similarly, the demographic groups most similar to Immigrants from Dominica are Venezuelan (2.6%, a difference of 0.10%), Nigerian (2.6%, a difference of 0.13%), Immigrants from Israel (2.6%, a difference of 0.15%), Immigrants from Singapore (2.6%, a difference of 0.21%), and Immigrants from South America (2.7%, a difference of 0.34%).
| Demographics | Rating | Rank | Hearing Disability |
| West Indians | 99.4 /100 | #42 | Exceptional 2.6% |
| Senegalese | 99.4 /100 | #43 | Exceptional 2.6% |
| Nigerians | 99.4 /100 | #44 | Exceptional 2.6% |
| Venezuelans | 99.4 /100 | #45 | Exceptional 2.6% |
| Immigrants | Dominica | 99.3 /100 | #46 | Exceptional 2.6% |
| Immigrants | Israel | 99.3 /100 | #47 | Exceptional 2.6% |
| Immigrants | Singapore | 99.3 /100 | #48 | Exceptional 2.6% |
| Immigrants | South America | 99.2 /100 | #49 | Exceptional 2.7% |
| Paraguayans | 99.2 /100 | #50 | Exceptional 2.7% |
| Immigrants | Hong Kong | 99.2 /100 | #51 | Exceptional 2.7% |
| Jamaicans | 99.0 /100 | #52 | Exceptional 2.7% |
| Immigrants | Eastern Asia | 99.0 /100 | #53 | Exceptional 2.7% |
| Ethiopians | 99.0 /100 | #54 | Exceptional 2.7% |
| Immigrants | Ethiopia | 99.0 /100 | #55 | Exceptional 2.7% |
| Immigrants | Nicaragua | 99.0 /100 | #56 | Exceptional 2.7% |
| South Americans | 99.0 /100 | #57 | Exceptional 2.7% |
| Immigrants | Peru | 98.6 /100 | #58 | Exceptional 2.7% |
| Immigrants | Eritrea | 98.5 /100 | #59 | Exceptional 2.7% |
| Immigrants | Egypt | 98.5 /100 | #60 | Exceptional 2.7% |
| Immigrants | Uzbekistan | 98.4 /100 | #61 | Exceptional 2.7% |
| Immigrants | Colombia | 98.4 /100 | #62 | Exceptional 2.7% |