Immigrants from Eritrea vs Sierra Leonean Hearing Disability
COMPARE
Immigrants from Eritrea
Sierra Leonean
Hearing Disability
Hearing Disability Comparison
Immigrants from Eritrea
Sierra Leoneans
2.7%
HEARING DISABILITY
98.5/ 100
METRIC RATING
59th/ 347
METRIC RANK
2.5%
HEARING DISABILITY
99.9/ 100
METRIC RATING
13th/ 347
METRIC RANK
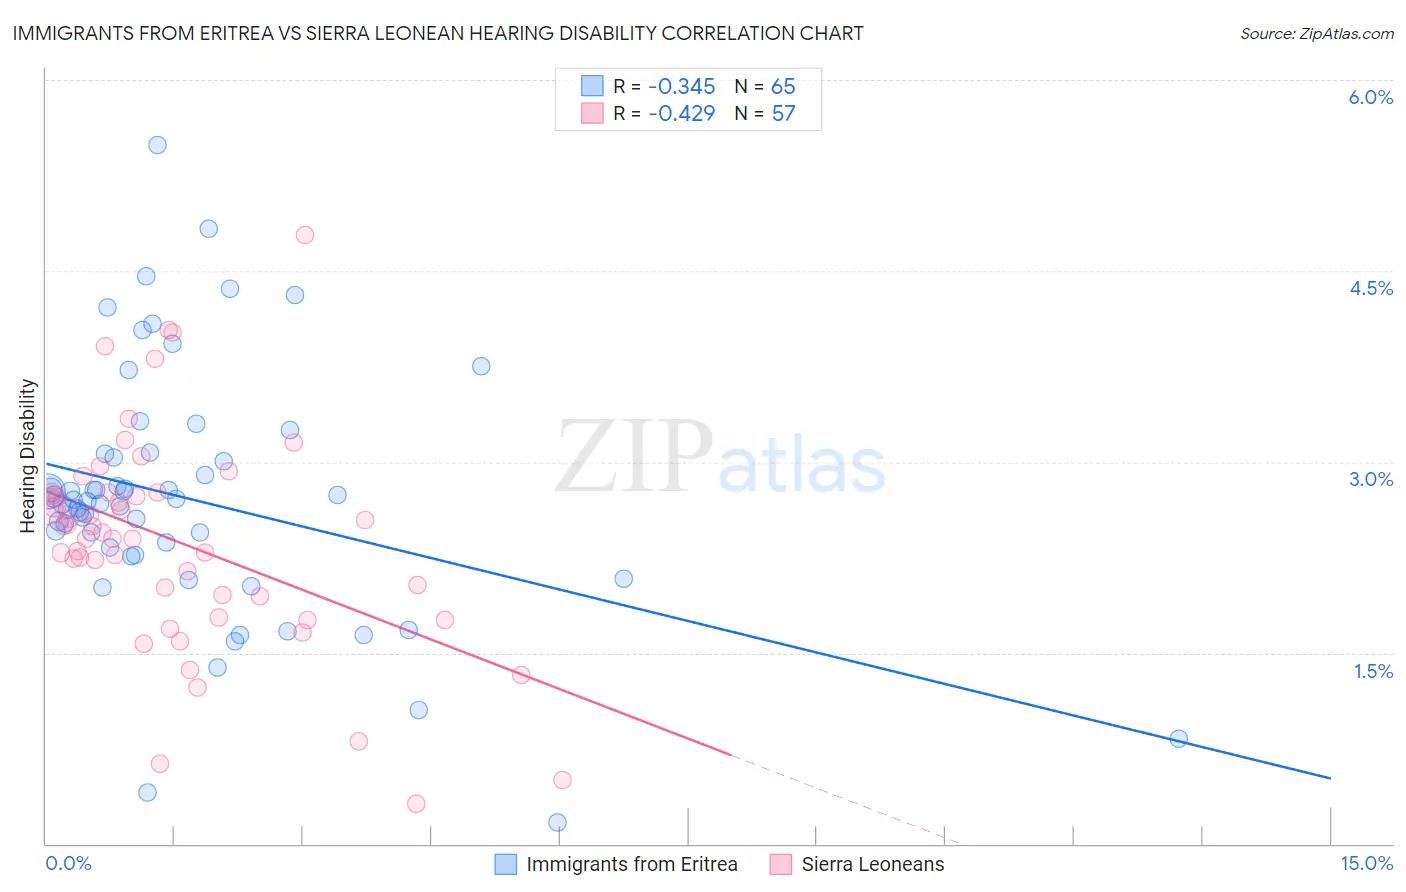
Immigrants from Eritrea vs Sierra Leonean Hearing Disability Correlation Chart
The statistical analysis conducted on geographies consisting of 104,850,181 people shows a mild negative correlation between the proportion of Immigrants from Eritrea and percentage of population with hearing disability in the United States with a correlation coefficient (R) of -0.345 and weighted average of 2.7%. Similarly, the statistical analysis conducted on geographies consisting of 83,339,030 people shows a moderate negative correlation between the proportion of Sierra Leoneans and percentage of population with hearing disability in the United States with a correlation coefficient (R) of -0.429 and weighted average of 2.5%, a difference of 7.9%.
Hearing Disability Correlation Summary
| Measurement | Immigrants from Eritrea | Sierra Leonean |
| Minimum | 0.17% | 0.31% |
| Maximum | 5.5% | 4.8% |
| Range | 5.3% | 4.5% |
| Mean | 2.7% | 2.4% |
| Median | 2.7% | 2.4% |
| Interquartile 25% (IQ1) | 2.3% | 1.9% |
| Interquartile 75% (IQ3) | 3.0% | 2.8% |
| Interquartile Range (IQR) | 0.75% | 0.89% |
| Standard Deviation (Sample) | 0.97% | 0.86% |
| Standard Deviation (Population) | 0.96% | 0.85% |
Similar Demographics by Hearing Disability
Demographics Similar to Immigrants from Eritrea by Hearing Disability
In terms of hearing disability, the demographic groups most similar to Immigrants from Eritrea are Immigrants from Egypt (2.7%, a difference of 0.070%), Immigrants from Peru (2.7%, a difference of 0.11%), Immigrants from Uzbekistan (2.7%, a difference of 0.20%), Immigrants from Colombia (2.7%, a difference of 0.21%), and Indian (Asian) (2.7%, a difference of 0.26%).
| Demographics | Rating | Rank | Hearing Disability |
| Jamaicans | 99.0 /100 | #52 | Exceptional 2.7% |
| Immigrants | Eastern Asia | 99.0 /100 | #53 | Exceptional 2.7% |
| Ethiopians | 99.0 /100 | #54 | Exceptional 2.7% |
| Immigrants | Ethiopia | 99.0 /100 | #55 | Exceptional 2.7% |
| Immigrants | Nicaragua | 99.0 /100 | #56 | Exceptional 2.7% |
| South Americans | 99.0 /100 | #57 | Exceptional 2.7% |
| Immigrants | Peru | 98.6 /100 | #58 | Exceptional 2.7% |
| Immigrants | Eritrea | 98.5 /100 | #59 | Exceptional 2.7% |
| Immigrants | Egypt | 98.5 /100 | #60 | Exceptional 2.7% |
| Immigrants | Uzbekistan | 98.4 /100 | #61 | Exceptional 2.7% |
| Immigrants | Colombia | 98.4 /100 | #62 | Exceptional 2.7% |
| Indians (Asian) | 98.4 /100 | #63 | Exceptional 2.7% |
| Immigrants | Sri Lanka | 98.4 /100 | #64 | Exceptional 2.7% |
| Immigrants | Nepal | 98.3 /100 | #65 | Exceptional 2.7% |
| Immigrants | Belize | 98.2 /100 | #66 | Exceptional 2.7% |
Demographics Similar to Sierra Leoneans by Hearing Disability
In terms of hearing disability, the demographic groups most similar to Sierra Leoneans are Trinidadian and Tobagonian (2.5%, a difference of 0.22%), Ecuadorian (2.5%, a difference of 0.32%), Immigrants from Trinidad and Tobago (2.5%, a difference of 0.53%), Barbadian (2.5%, a difference of 0.62%), and Immigrants from West Indies (2.5%, a difference of 0.77%).
| Demographics | Rating | Rank | Hearing Disability |
| Vietnamese | 100.0 /100 | #6 | Exceptional 2.4% |
| Immigrants | Bangladesh | 100.0 /100 | #7 | Exceptional 2.4% |
| British West Indians | 100.0 /100 | #8 | Exceptional 2.4% |
| Immigrants | Dominican Republic | 100.0 /100 | #9 | Exceptional 2.4% |
| Immigrants | Ecuador | 99.9 /100 | #10 | Exceptional 2.5% |
| Immigrants | Trinidad and Tobago | 99.9 /100 | #11 | Exceptional 2.5% |
| Trinidadians and Tobagonians | 99.9 /100 | #12 | Exceptional 2.5% |
| Sierra Leoneans | 99.9 /100 | #13 | Exceptional 2.5% |
| Ecuadorians | 99.9 /100 | #14 | Exceptional 2.5% |
| Barbadians | 99.9 /100 | #15 | Exceptional 2.5% |
| Immigrants | West Indies | 99.9 /100 | #16 | Exceptional 2.5% |
| Immigrants | India | 99.9 /100 | #17 | Exceptional 2.5% |
| Dominicans | 99.8 /100 | #18 | Exceptional 2.5% |
| Thais | 99.8 /100 | #19 | Exceptional 2.5% |
| Immigrants | Bolivia | 99.8 /100 | #20 | Exceptional 2.5% |