Immigrants from Eritrea vs Czechoslovakian Hearing Disability
COMPARE
Immigrants from Eritrea
Czechoslovakian
Hearing Disability
Hearing Disability Comparison
Immigrants from Eritrea
Czechoslovakians
2.7%
HEARING DISABILITY
98.5/ 100
METRIC RATING
59th/ 347
METRIC RANK
3.6%
HEARING DISABILITY
0.0/ 100
METRIC RATING
275th/ 347
METRIC RANK
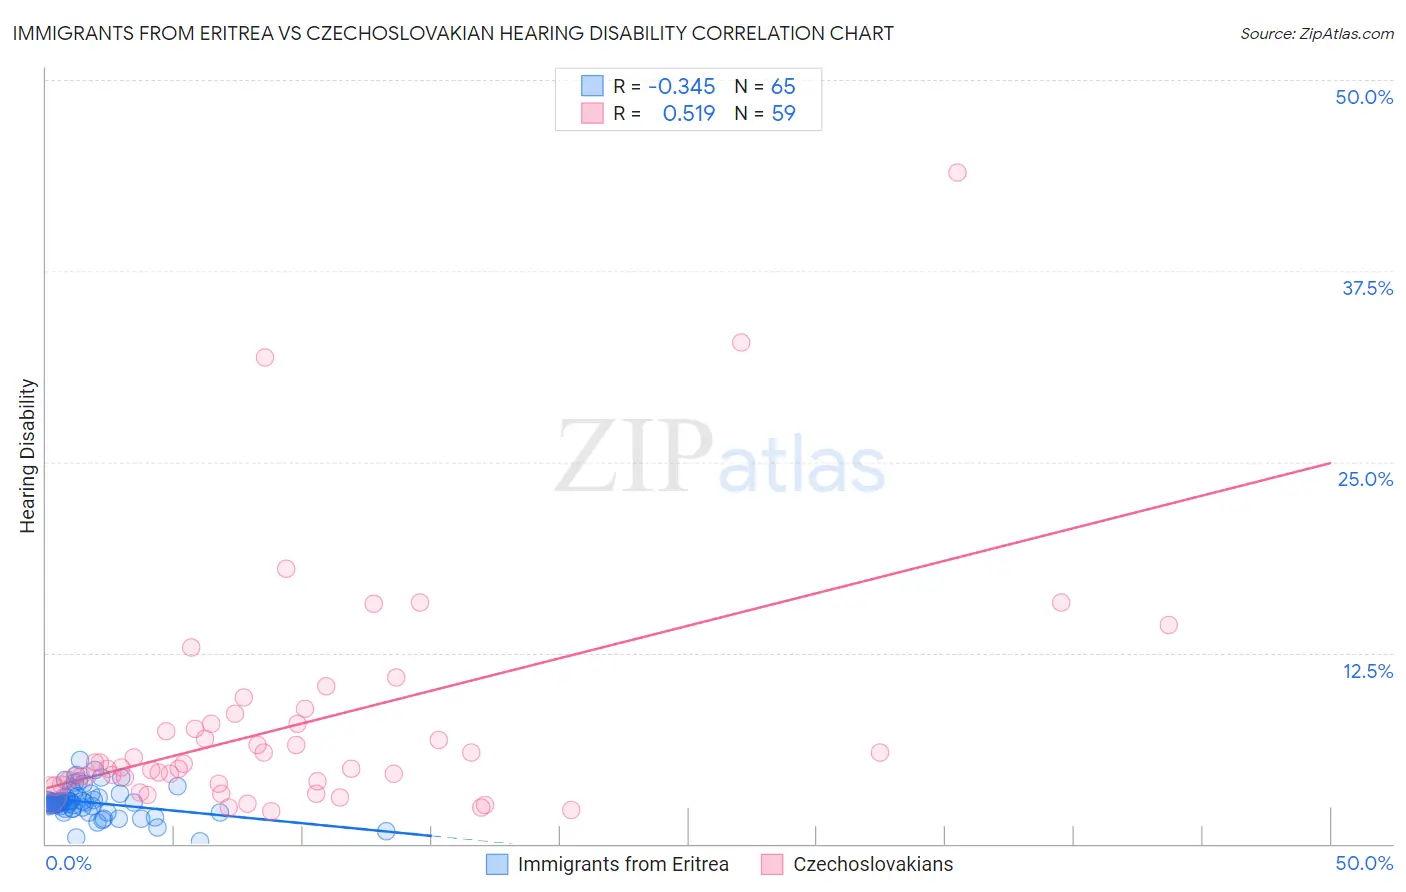
Immigrants from Eritrea vs Czechoslovakian Hearing Disability Correlation Chart
The statistical analysis conducted on geographies consisting of 104,850,181 people shows a mild negative correlation between the proportion of Immigrants from Eritrea and percentage of population with hearing disability in the United States with a correlation coefficient (R) of -0.345 and weighted average of 2.7%. Similarly, the statistical analysis conducted on geographies consisting of 368,630,521 people shows a substantial positive correlation between the proportion of Czechoslovakians and percentage of population with hearing disability in the United States with a correlation coefficient (R) of 0.519 and weighted average of 3.6%, a difference of 31.6%.
Hearing Disability Correlation Summary
| Measurement | Immigrants from Eritrea | Czechoslovakian |
| Minimum | 0.17% | 2.1% |
| Maximum | 5.5% | 44.0% |
| Range | 5.3% | 41.8% |
| Mean | 2.7% | 7.8% |
| Median | 2.7% | 5.0% |
| Interquartile 25% (IQ1) | 2.3% | 3.9% |
| Interquartile 75% (IQ3) | 3.0% | 7.9% |
| Interquartile Range (IQR) | 0.75% | 4.0% |
| Standard Deviation (Sample) | 0.97% | 7.7% |
| Standard Deviation (Population) | 0.96% | 7.6% |
Similar Demographics by Hearing Disability
Demographics Similar to Immigrants from Eritrea by Hearing Disability
In terms of hearing disability, the demographic groups most similar to Immigrants from Eritrea are Immigrants from Egypt (2.7%, a difference of 0.070%), Immigrants from Peru (2.7%, a difference of 0.11%), Immigrants from Uzbekistan (2.7%, a difference of 0.20%), Immigrants from Colombia (2.7%, a difference of 0.21%), and Indian (Asian) (2.7%, a difference of 0.26%).
| Demographics | Rating | Rank | Hearing Disability |
| Jamaicans | 99.0 /100 | #52 | Exceptional 2.7% |
| Immigrants | Eastern Asia | 99.0 /100 | #53 | Exceptional 2.7% |
| Ethiopians | 99.0 /100 | #54 | Exceptional 2.7% |
| Immigrants | Ethiopia | 99.0 /100 | #55 | Exceptional 2.7% |
| Immigrants | Nicaragua | 99.0 /100 | #56 | Exceptional 2.7% |
| South Americans | 99.0 /100 | #57 | Exceptional 2.7% |
| Immigrants | Peru | 98.6 /100 | #58 | Exceptional 2.7% |
| Immigrants | Eritrea | 98.5 /100 | #59 | Exceptional 2.7% |
| Immigrants | Egypt | 98.5 /100 | #60 | Exceptional 2.7% |
| Immigrants | Uzbekistan | 98.4 /100 | #61 | Exceptional 2.7% |
| Immigrants | Colombia | 98.4 /100 | #62 | Exceptional 2.7% |
| Indians (Asian) | 98.4 /100 | #63 | Exceptional 2.7% |
| Immigrants | Sri Lanka | 98.4 /100 | #64 | Exceptional 2.7% |
| Immigrants | Nepal | 98.3 /100 | #65 | Exceptional 2.7% |
| Immigrants | Belize | 98.2 /100 | #66 | Exceptional 2.7% |
Demographics Similar to Czechoslovakians by Hearing Disability
In terms of hearing disability, the demographic groups most similar to Czechoslovakians are Danish (3.6%, a difference of 0.12%), Swiss (3.5%, a difference of 0.20%), Puerto Rican (3.5%, a difference of 0.53%), Fijian (3.5%, a difference of 0.60%), and Nonimmigrants (3.6%, a difference of 0.82%).
| Demographics | Rating | Rank | Hearing Disability |
| Spaniards | 0.1 /100 | #268 | Tragic 3.5% |
| Ute | 0.1 /100 | #269 | Tragic 3.5% |
| Europeans | 0.1 /100 | #270 | Tragic 3.5% |
| Czechs | 0.1 /100 | #271 | Tragic 3.5% |
| Fijians | 0.0 /100 | #272 | Tragic 3.5% |
| Puerto Ricans | 0.0 /100 | #273 | Tragic 3.5% |
| Swiss | 0.0 /100 | #274 | Tragic 3.5% |
| Czechoslovakians | 0.0 /100 | #275 | Tragic 3.6% |
| Danes | 0.0 /100 | #276 | Tragic 3.6% |
| Immigrants | Nonimmigrants | 0.0 /100 | #277 | Tragic 3.6% |
| Basques | 0.0 /100 | #278 | Tragic 3.6% |
| Slovaks | 0.0 /100 | #279 | Tragic 3.6% |
| French American Indians | 0.0 /100 | #280 | Tragic 3.6% |
| Scandinavians | 0.0 /100 | #281 | Tragic 3.6% |
| Swedes | 0.0 /100 | #282 | Tragic 3.6% |