Immigrants from Eritrea vs Chinese Hearing Disability
COMPARE
Immigrants from Eritrea
Chinese
Hearing Disability
Hearing Disability Comparison
Immigrants from Eritrea
Chinese
2.7%
HEARING DISABILITY
98.5/ 100
METRIC RATING
59th/ 347
METRIC RANK
3.7%
HEARING DISABILITY
0.0/ 100
METRIC RATING
289th/ 347
METRIC RANK
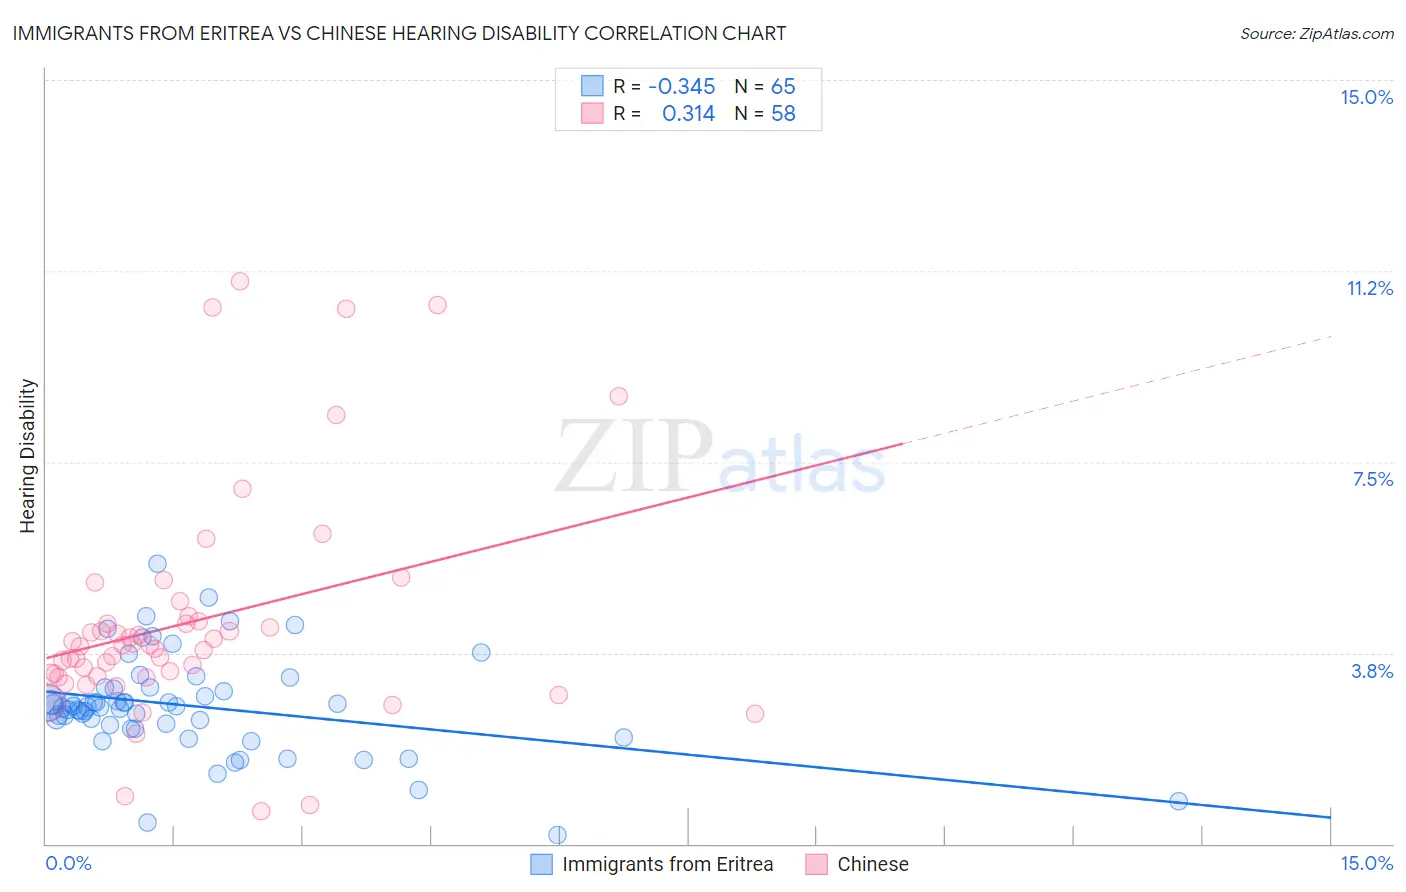
Immigrants from Eritrea vs Chinese Hearing Disability Correlation Chart
The statistical analysis conducted on geographies consisting of 104,850,181 people shows a mild negative correlation between the proportion of Immigrants from Eritrea and percentage of population with hearing disability in the United States with a correlation coefficient (R) of -0.345 and weighted average of 2.7%. Similarly, the statistical analysis conducted on geographies consisting of 64,801,631 people shows a mild positive correlation between the proportion of Chinese and percentage of population with hearing disability in the United States with a correlation coefficient (R) of 0.314 and weighted average of 3.7%, a difference of 36.3%.
Hearing Disability Correlation Summary
| Measurement | Immigrants from Eritrea | Chinese |
| Minimum | 0.17% | 0.63% |
| Maximum | 5.5% | 11.0% |
| Range | 5.3% | 10.4% |
| Mean | 2.7% | 4.4% |
| Median | 2.7% | 3.9% |
| Interquartile 25% (IQ1) | 2.3% | 3.3% |
| Interquartile 75% (IQ3) | 3.0% | 4.4% |
| Interquartile Range (IQR) | 0.75% | 1.1% |
| Standard Deviation (Sample) | 0.97% | 2.2% |
| Standard Deviation (Population) | 0.96% | 2.2% |
Similar Demographics by Hearing Disability
Demographics Similar to Immigrants from Eritrea by Hearing Disability
In terms of hearing disability, the demographic groups most similar to Immigrants from Eritrea are Immigrants from Egypt (2.7%, a difference of 0.070%), Immigrants from Peru (2.7%, a difference of 0.11%), Immigrants from Uzbekistan (2.7%, a difference of 0.20%), Immigrants from Colombia (2.7%, a difference of 0.21%), and Indian (Asian) (2.7%, a difference of 0.26%).
| Demographics | Rating | Rank | Hearing Disability |
| Jamaicans | 99.0 /100 | #52 | Exceptional 2.7% |
| Immigrants | Eastern Asia | 99.0 /100 | #53 | Exceptional 2.7% |
| Ethiopians | 99.0 /100 | #54 | Exceptional 2.7% |
| Immigrants | Ethiopia | 99.0 /100 | #55 | Exceptional 2.7% |
| Immigrants | Nicaragua | 99.0 /100 | #56 | Exceptional 2.7% |
| South Americans | 99.0 /100 | #57 | Exceptional 2.7% |
| Immigrants | Peru | 98.6 /100 | #58 | Exceptional 2.7% |
| Immigrants | Eritrea | 98.5 /100 | #59 | Exceptional 2.7% |
| Immigrants | Egypt | 98.5 /100 | #60 | Exceptional 2.7% |
| Immigrants | Uzbekistan | 98.4 /100 | #61 | Exceptional 2.7% |
| Immigrants | Colombia | 98.4 /100 | #62 | Exceptional 2.7% |
| Indians (Asian) | 98.4 /100 | #63 | Exceptional 2.7% |
| Immigrants | Sri Lanka | 98.4 /100 | #64 | Exceptional 2.7% |
| Immigrants | Nepal | 98.3 /100 | #65 | Exceptional 2.7% |
| Immigrants | Belize | 98.2 /100 | #66 | Exceptional 2.7% |
Demographics Similar to Chinese by Hearing Disability
In terms of hearing disability, the demographic groups most similar to Chinese are White/Caucasian (3.7%, a difference of 0.13%), Finnish (3.7%, a difference of 0.15%), Irish (3.7%, a difference of 0.21%), Native Hawaiian (3.7%, a difference of 0.21%), and Norwegian (3.7%, a difference of 0.27%).
| Demographics | Rating | Rank | Hearing Disability |
| Swedes | 0.0 /100 | #282 | Tragic 3.6% |
| Blackfeet | 0.0 /100 | #283 | Tragic 3.6% |
| Immigrants | Micronesia | 0.0 /100 | #284 | Tragic 3.6% |
| Sioux | 0.0 /100 | #285 | Tragic 3.6% |
| Delaware | 0.0 /100 | #286 | Tragic 3.6% |
| Spanish | 0.0 /100 | #287 | Tragic 3.7% |
| Irish | 0.0 /100 | #288 | Tragic 3.7% |
| Chinese | 0.0 /100 | #289 | Tragic 3.7% |
| Whites/Caucasians | 0.0 /100 | #290 | Tragic 3.7% |
| Finns | 0.0 /100 | #291 | Tragic 3.7% |
| Native Hawaiians | 0.0 /100 | #292 | Tragic 3.7% |
| Norwegians | 0.0 /100 | #293 | Tragic 3.7% |
| Iroquois | 0.0 /100 | #294 | Tragic 3.7% |
| Welsh | 0.0 /100 | #295 | Tragic 3.7% |
| Pima | 0.0 /100 | #296 | Tragic 3.7% |