Immigrants from England vs British West Indian In Labor Force | Age 45-54
COMPARE
Immigrants from England
British West Indian
In Labor Force | Age 45-54
In Labor Force | Age 45-54 Comparison
Immigrants from England
British West Indians
82.6%
IN LABOR FORCE | AGE 45-54
32.2/ 100
METRIC RATING
185th/ 347
METRIC RANK
81.2%
IN LABOR FORCE | AGE 45-54
0.0/ 100
METRIC RATING
274th/ 347
METRIC RANK
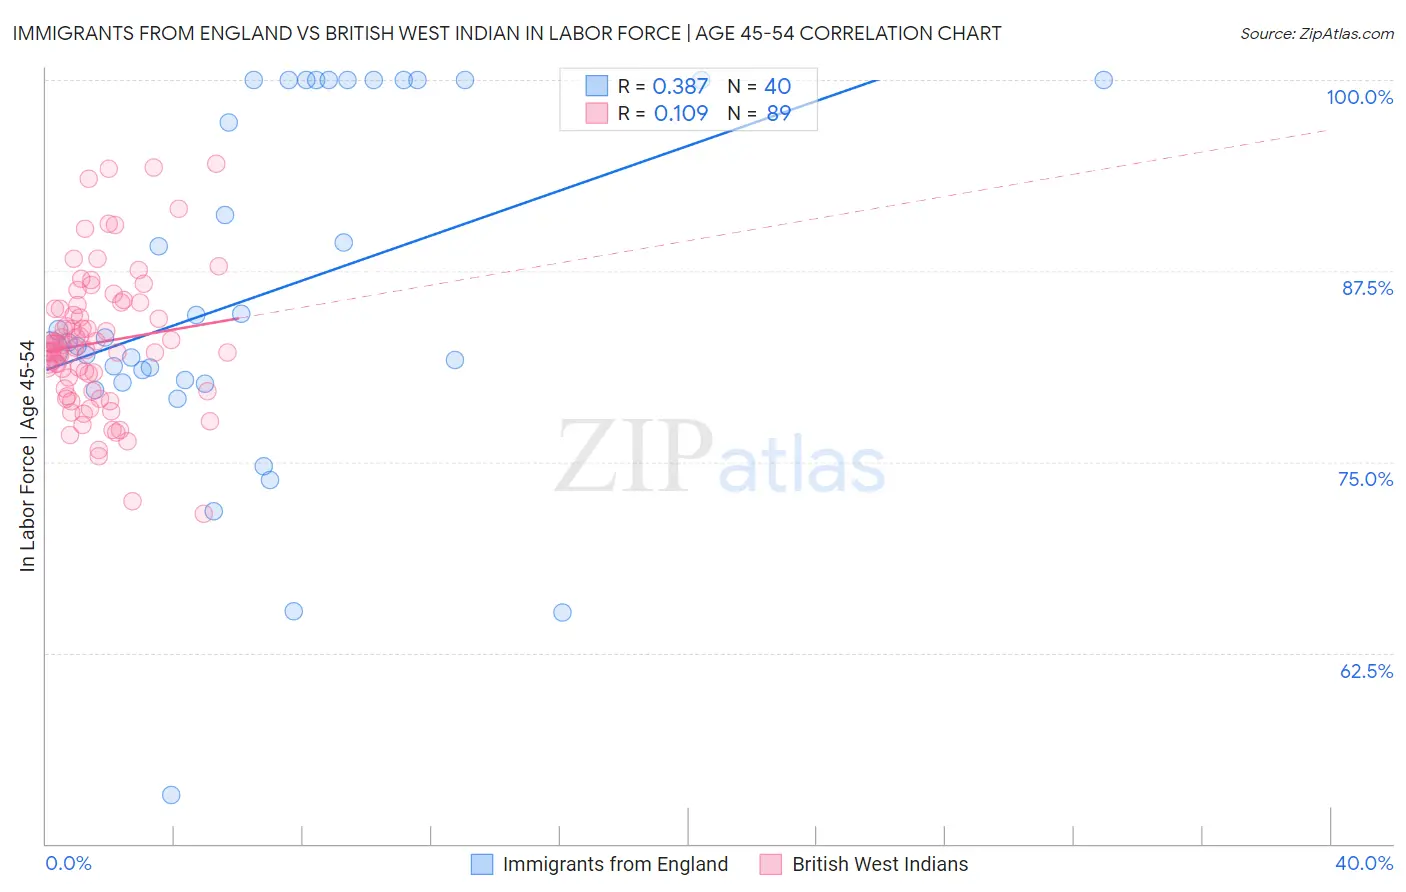
Immigrants from England vs British West Indian In Labor Force | Age 45-54 Correlation Chart
The statistical analysis conducted on geographies consisting of 391,754,250 people shows a mild positive correlation between the proportion of Immigrants from England and labor force participation rate among population between the ages 45 and 54 in the United States with a correlation coefficient (R) of 0.387 and weighted average of 82.6%. Similarly, the statistical analysis conducted on geographies consisting of 152,595,623 people shows a poor positive correlation between the proportion of British West Indians and labor force participation rate among population between the ages 45 and 54 in the United States with a correlation coefficient (R) of 0.109 and weighted average of 81.2%, a difference of 1.7%.
In Labor Force | Age 45-54 Correlation Summary
| Measurement | Immigrants from England | British West Indian |
| Minimum | 53.2% | 71.6% |
| Maximum | 100.0% | 94.5% |
| Range | 46.8% | 22.9% |
| Mean | 86.1% | 82.8% |
| Median | 83.0% | 82.5% |
| Interquartile 25% (IQ1) | 80.3% | 79.7% |
| Interquartile 75% (IQ3) | 100.0% | 85.2% |
| Interquartile Range (IQR) | 19.7% | 5.5% |
| Standard Deviation (Sample) | 11.7% | 4.5% |
| Standard Deviation (Population) | 11.5% | 4.5% |
Similar Demographics by In Labor Force | Age 45-54
Demographics Similar to Immigrants from England by In Labor Force | Age 45-54
In terms of in labor force | age 45-54, the demographic groups most similar to Immigrants from England are New Zealander (82.6%, a difference of 0.0%), European (82.6%, a difference of 0.0%), Irish (82.6%, a difference of 0.030%), Immigrants from Costa Rica (82.6%, a difference of 0.040%), and South African (82.6%, a difference of 0.040%).
| Demographics | Rating | Rank | In Labor Force | Age 45-54 |
| Nigerians | 40.5 /100 | #178 | Average 82.7% |
| Immigrants | Switzerland | 39.4 /100 | #179 | Fair 82.7% |
| Hungarians | 38.0 /100 | #180 | Fair 82.7% |
| Israelis | 37.7 /100 | #181 | Fair 82.7% |
| Immigrants | Hungary | 37.1 /100 | #182 | Fair 82.7% |
| New Zealanders | 32.7 /100 | #183 | Fair 82.6% |
| Europeans | 32.6 /100 | #184 | Fair 82.6% |
| Immigrants | England | 32.2 /100 | #185 | Fair 82.6% |
| Irish | 29.2 /100 | #186 | Fair 82.6% |
| Immigrants | Costa Rica | 28.3 /100 | #187 | Fair 82.6% |
| South Africans | 28.0 /100 | #188 | Fair 82.6% |
| Syrians | 26.0 /100 | #189 | Fair 82.6% |
| British | 25.7 /100 | #190 | Fair 82.6% |
| Armenians | 23.2 /100 | #191 | Fair 82.5% |
| Immigrants | Iraq | 20.9 /100 | #192 | Fair 82.5% |
Demographics Similar to British West Indians by In Labor Force | Age 45-54
In terms of in labor force | age 45-54, the demographic groups most similar to British West Indians are Nonimmigrants (81.2%, a difference of 0.010%), Chippewa (81.3%, a difference of 0.030%), U.S. Virgin Islander (81.2%, a difference of 0.050%), Guatemalan (81.2%, a difference of 0.070%), and Immigrants from Barbados (81.3%, a difference of 0.10%).
| Demographics | Rating | Rank | In Labor Force | Age 45-54 |
| West Indians | 0.1 /100 | #267 | Tragic 81.4% |
| Immigrants | Honduras | 0.0 /100 | #268 | Tragic 81.4% |
| Alsatians | 0.0 /100 | #269 | Tragic 81.3% |
| Bangladeshis | 0.0 /100 | #270 | Tragic 81.3% |
| Immigrants | Barbados | 0.0 /100 | #271 | Tragic 81.3% |
| Spanish | 0.0 /100 | #272 | Tragic 81.3% |
| Chippewa | 0.0 /100 | #273 | Tragic 81.3% |
| British West Indians | 0.0 /100 | #274 | Tragic 81.2% |
| Immigrants | Nonimmigrants | 0.0 /100 | #275 | Tragic 81.2% |
| U.S. Virgin Islanders | 0.0 /100 | #276 | Tragic 81.2% |
| Guatemalans | 0.0 /100 | #277 | Tragic 81.2% |
| Immigrants | Guatemala | 0.0 /100 | #278 | Tragic 81.1% |
| Immigrants | Micronesia | 0.0 /100 | #279 | Tragic 81.1% |
| Immigrants | Latin America | 0.0 /100 | #280 | Tragic 81.0% |
| Immigrants | Grenada | 0.0 /100 | #281 | Tragic 81.0% |