Immigrants from Egypt vs Shoshone No Vehicles in Household
COMPARE
Immigrants from Egypt
Shoshone
No Vehicles in Household
No Vehicles in Household Comparison
Immigrants from Egypt
Shoshone
12.2%
NO VEHICLES IN HOUSEHOLD
0.6/ 100
METRIC RATING
263rd/ 347
METRIC RANK
10.8%
NO VEHICLES IN HOUSEHOLD
24.1/ 100
METRIC RATING
197th/ 347
METRIC RANK
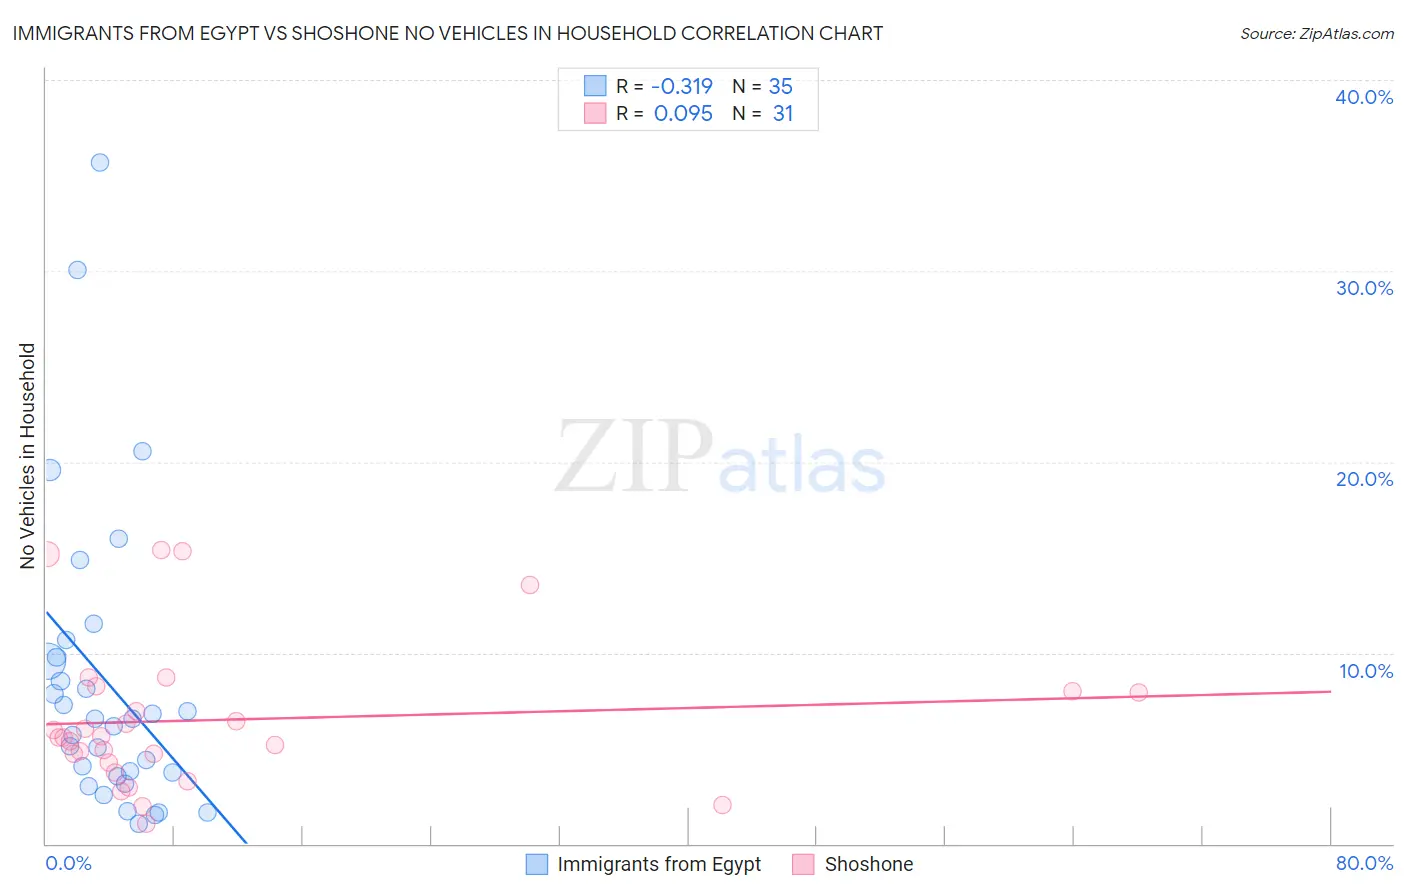
Immigrants from Egypt vs Shoshone No Vehicles in Household Correlation Chart
The statistical analysis conducted on geographies consisting of 245,144,275 people shows a mild negative correlation between the proportion of Immigrants from Egypt and percentage of households with no vehicle available in the United States with a correlation coefficient (R) of -0.319 and weighted average of 12.2%. Similarly, the statistical analysis conducted on geographies consisting of 66,540,828 people shows a slight positive correlation between the proportion of Shoshone and percentage of households with no vehicle available in the United States with a correlation coefficient (R) of 0.095 and weighted average of 10.8%, a difference of 13.2%.
No Vehicles in Household Correlation Summary
| Measurement | Immigrants from Egypt | Shoshone |
| Minimum | 1.1% | 1.0% |
| Maximum | 35.7% | 15.4% |
| Range | 34.6% | 14.3% |
| Mean | 8.4% | 6.5% |
| Median | 6.5% | 5.6% |
| Interquartile 25% (IQ1) | 3.6% | 4.3% |
| Interquartile 75% (IQ3) | 9.7% | 8.0% |
| Interquartile Range (IQR) | 6.2% | 3.7% |
| Standard Deviation (Sample) | 7.8% | 3.8% |
| Standard Deviation (Population) | 7.7% | 3.8% |
Similar Demographics by No Vehicles in Household
Demographics Similar to Immigrants from Egypt by No Vehicles in Household
In terms of no vehicles in household, the demographic groups most similar to Immigrants from Egypt are Immigrants from Liberia (12.2%, a difference of 0.15%), Subsaharan African (12.2%, a difference of 0.22%), Immigrants from Switzerland (12.3%, a difference of 0.46%), Macedonian (12.2%, a difference of 0.61%), and African (12.3%, a difference of 0.71%).
| Demographics | Rating | Rank | No Vehicles in Household |
| Liberians | 1.2 /100 | #256 | Tragic 12.0% |
| Nigerians | 0.9 /100 | #257 | Tragic 12.1% |
| South American Indians | 0.9 /100 | #258 | Tragic 12.1% |
| Immigrants | Latvia | 0.8 /100 | #259 | Tragic 12.1% |
| Macedonians | 0.7 /100 | #260 | Tragic 12.2% |
| Sub-Saharan Africans | 0.6 /100 | #261 | Tragic 12.2% |
| Immigrants | Liberia | 0.6 /100 | #262 | Tragic 12.2% |
| Immigrants | Egypt | 0.6 /100 | #263 | Tragic 12.2% |
| Immigrants | Switzerland | 0.5 /100 | #264 | Tragic 12.3% |
| Africans | 0.4 /100 | #265 | Tragic 12.3% |
| Israelis | 0.3 /100 | #266 | Tragic 12.4% |
| Immigrants | Europe | 0.3 /100 | #267 | Tragic 12.5% |
| Immigrants | Africa | 0.2 /100 | #268 | Tragic 12.5% |
| Panamanians | 0.2 /100 | #269 | Tragic 12.5% |
| Immigrants | Northern Africa | 0.2 /100 | #270 | Tragic 12.6% |
Demographics Similar to Shoshone by No Vehicles in Household
In terms of no vehicles in household, the demographic groups most similar to Shoshone are Central American (10.8%, a difference of 0.040%), Immigrants from Sweden (10.8%, a difference of 0.21%), Immigrants from Brazil (10.8%, a difference of 0.38%), Pueblo (10.8%, a difference of 0.50%), and Immigrants from Asia (10.9%, a difference of 0.52%).
| Demographics | Rating | Rank | No Vehicles in Household |
| Immigrants | North Macedonia | 34.6 /100 | #190 | Fair 10.6% |
| Immigrants | Northern Europe | 33.1 /100 | #191 | Fair 10.7% |
| Carpatho Rusyns | 32.1 /100 | #192 | Fair 10.7% |
| Ukrainians | 28.0 /100 | #193 | Fair 10.7% |
| Pueblo | 27.0 /100 | #194 | Fair 10.8% |
| Immigrants | Brazil | 26.3 /100 | #195 | Fair 10.8% |
| Central Americans | 24.3 /100 | #196 | Fair 10.8% |
| Shoshone | 24.1 /100 | #197 | Fair 10.8% |
| Immigrants | Sweden | 22.9 /100 | #198 | Fair 10.8% |
| Immigrants | Asia | 21.3 /100 | #199 | Fair 10.9% |
| Cambodians | 19.6 /100 | #200 | Poor 10.9% |
| Immigrants | Western Europe | 19.1 /100 | #201 | Poor 10.9% |
| Romanians | 17.9 /100 | #202 | Poor 10.9% |
| Iroquois | 17.6 /100 | #203 | Poor 10.9% |
| Guatemalans | 16.1 /100 | #204 | Poor 11.0% |