Immigrants from Egypt vs Pueblo Disability
COMPARE
Immigrants from Egypt
Pueblo
Disability
Disability Comparison
Immigrants from Egypt
Pueblo
10.6%
DISABILITY
100.0/ 100
METRIC RATING
31st/ 347
METRIC RANK
14.4%
DISABILITY
0.0/ 100
METRIC RATING
332nd/ 347
METRIC RANK
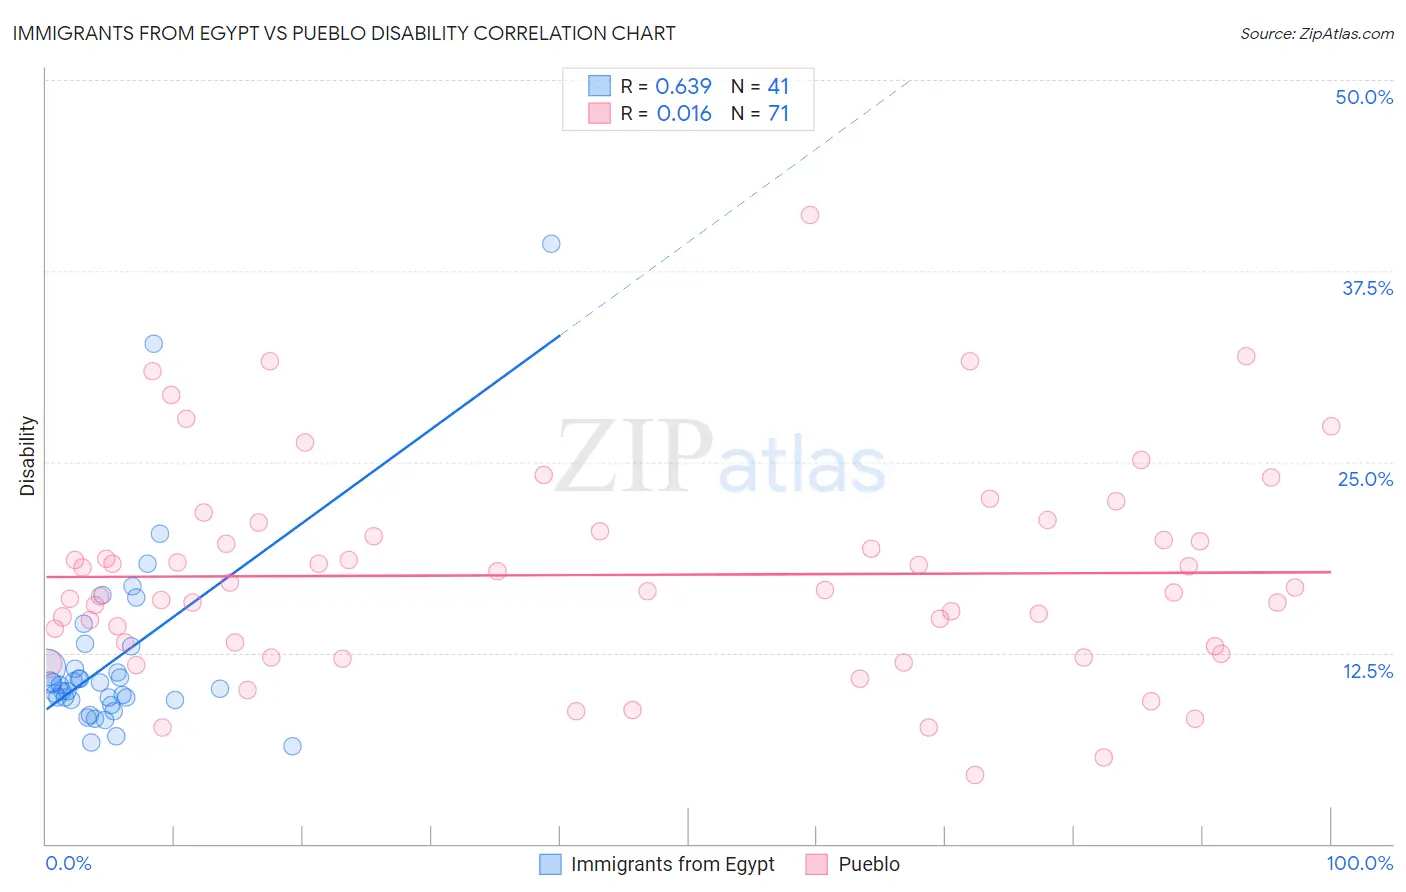
Immigrants from Egypt vs Pueblo Disability Correlation Chart
The statistical analysis conducted on geographies consisting of 245,492,432 people shows a significant positive correlation between the proportion of Immigrants from Egypt and percentage of population with a disability in the United States with a correlation coefficient (R) of 0.639 and weighted average of 10.6%. Similarly, the statistical analysis conducted on geographies consisting of 120,077,777 people shows no correlation between the proportion of Pueblo and percentage of population with a disability in the United States with a correlation coefficient (R) of 0.016 and weighted average of 14.4%, a difference of 35.8%.
Disability Correlation Summary
| Measurement | Immigrants from Egypt | Pueblo |
| Minimum | 6.4% | 4.5% |
| Maximum | 39.3% | 41.2% |
| Range | 32.9% | 36.7% |
| Mean | 12.1% | 17.6% |
| Median | 10.4% | 16.6% |
| Interquartile 25% (IQ1) | 9.4% | 13.0% |
| Interquartile 75% (IQ3) | 12.2% | 20.5% |
| Interquartile Range (IQR) | 2.8% | 7.5% |
| Standard Deviation (Sample) | 6.3% | 6.9% |
| Standard Deviation (Population) | 6.2% | 6.8% |
Similar Demographics by Disability
Demographics Similar to Immigrants from Egypt by Disability
In terms of disability, the demographic groups most similar to Immigrants from Egypt are Immigrants from Turkey (10.6%, a difference of 0.070%), Paraguayan (10.6%, a difference of 0.10%), Immigrants from Argentina (10.6%, a difference of 0.23%), Egyptian (10.6%, a difference of 0.35%), and Immigrants from Kuwait (10.7%, a difference of 0.35%).
| Demographics | Rating | Rank | Disability |
| Venezuelans | 100.0 /100 | #24 | Exceptional 10.5% |
| Immigrants | Malaysia | 100.0 /100 | #25 | Exceptional 10.6% |
| Argentineans | 100.0 /100 | #26 | Exceptional 10.6% |
| Cypriots | 100.0 /100 | #27 | Exceptional 10.6% |
| Egyptians | 100.0 /100 | #28 | Exceptional 10.6% |
| Immigrants | Argentina | 100.0 /100 | #29 | Exceptional 10.6% |
| Immigrants | Turkey | 100.0 /100 | #30 | Exceptional 10.6% |
| Immigrants | Egypt | 100.0 /100 | #31 | Exceptional 10.6% |
| Paraguayans | 100.0 /100 | #32 | Exceptional 10.6% |
| Immigrants | Kuwait | 100.0 /100 | #33 | Exceptional 10.7% |
| Immigrants | Ethiopia | 100.0 /100 | #34 | Exceptional 10.7% |
| Immigrants | Indonesia | 100.0 /100 | #35 | Exceptional 10.7% |
| Ethiopians | 100.0 /100 | #36 | Exceptional 10.7% |
| Turks | 100.0 /100 | #37 | Exceptional 10.7% |
| Afghans | 99.9 /100 | #38 | Exceptional 10.8% |
Demographics Similar to Pueblo by Disability
In terms of disability, the demographic groups most similar to Pueblo are Alaskan Athabascan (14.4%, a difference of 0.020%), Cajun (14.6%, a difference of 1.1%), Yuman (14.6%, a difference of 1.2%), Navajo (14.3%, a difference of 1.3%), and Potawatomi (14.2%, a difference of 1.9%).
| Demographics | Rating | Rank | Disability |
| Natives/Alaskans | 0.0 /100 | #325 | Tragic 14.2% |
| Osage | 0.0 /100 | #326 | Tragic 14.2% |
| Ottawa | 0.0 /100 | #327 | Tragic 14.2% |
| Immigrants | Azores | 0.0 /100 | #328 | Tragic 14.2% |
| Potawatomi | 0.0 /100 | #329 | Tragic 14.2% |
| Navajo | 0.0 /100 | #330 | Tragic 14.3% |
| Alaskan Athabascans | 0.0 /100 | #331 | Tragic 14.4% |
| Pueblo | 0.0 /100 | #332 | Tragic 14.4% |
| Cajuns | 0.0 /100 | #333 | Tragic 14.6% |
| Yuman | 0.0 /100 | #334 | Tragic 14.6% |
| Tohono O'odham | 0.0 /100 | #335 | Tragic 14.8% |
| Cherokee | 0.0 /100 | #336 | Tragic 14.8% |
| Seminole | 0.0 /100 | #337 | Tragic 14.9% |
| Dutch West Indians | 0.0 /100 | #338 | Tragic 14.9% |
| Chickasaw | 0.0 /100 | #339 | Tragic 15.2% |