Immigrants from Eastern Asia vs English Disability
COMPARE
Immigrants from Eastern Asia
English
Disability
Disability Comparison
Immigrants from Eastern Asia
English
10.2%
DISABILITY
100.0/ 100
METRIC RATING
13th/ 347
METRIC RANK
13.0%
DISABILITY
0.0/ 100
METRIC RATING
286th/ 347
METRIC RANK
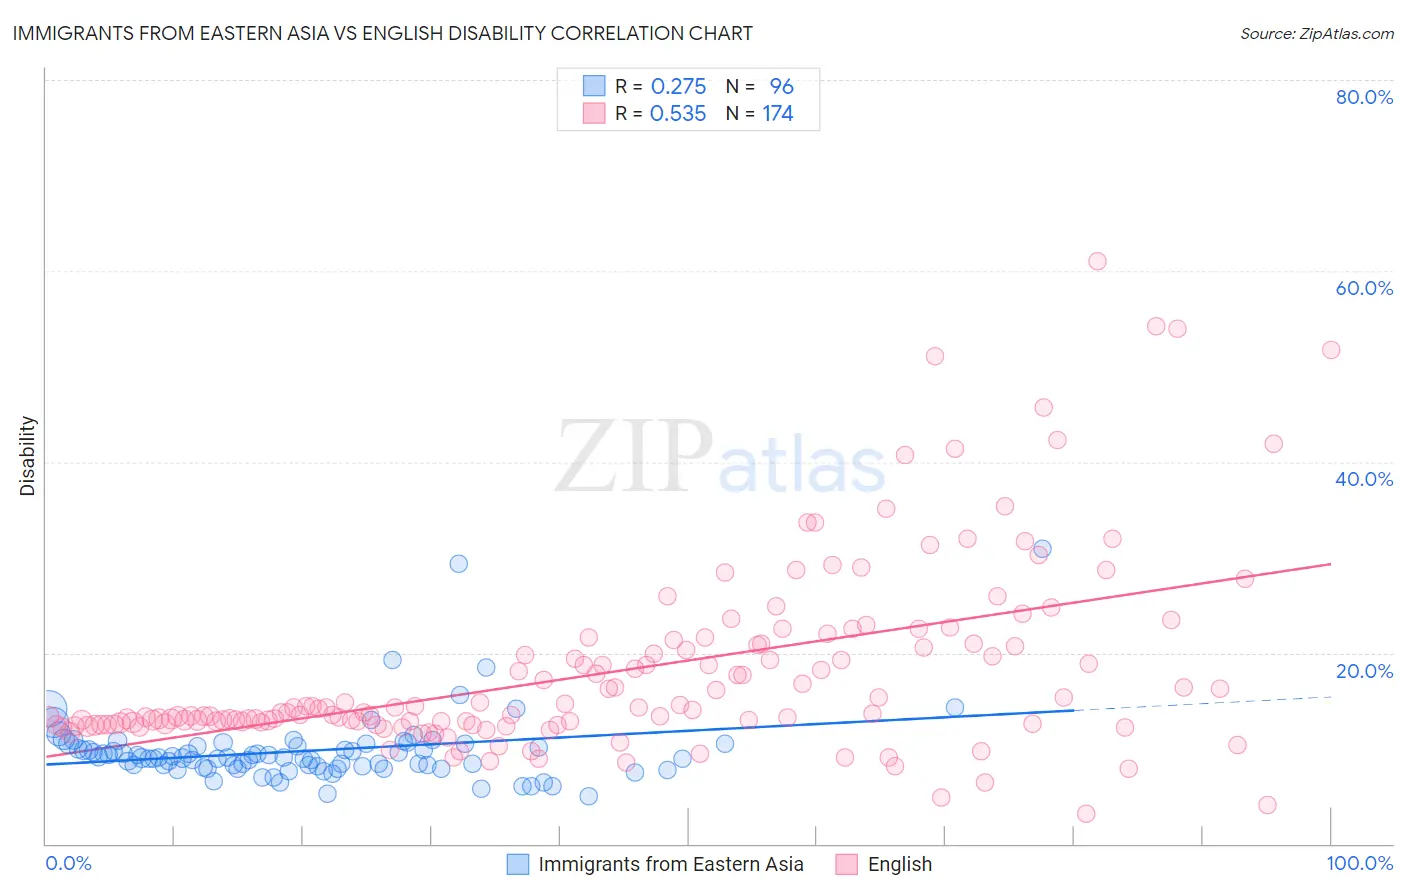
Immigrants from Eastern Asia vs English Disability Correlation Chart
The statistical analysis conducted on geographies consisting of 499,894,930 people shows a weak positive correlation between the proportion of Immigrants from Eastern Asia and percentage of population with a disability in the United States with a correlation coefficient (R) of 0.275 and weighted average of 10.2%. Similarly, the statistical analysis conducted on geographies consisting of 579,766,165 people shows a substantial positive correlation between the proportion of English and percentage of population with a disability in the United States with a correlation coefficient (R) of 0.535 and weighted average of 13.0%, a difference of 27.5%.
Disability Correlation Summary
| Measurement | Immigrants from Eastern Asia | English |
| Minimum | 4.9% | 3.2% |
| Maximum | 30.9% | 61.0% |
| Range | 26.0% | 57.9% |
| Mean | 9.8% | 18.0% |
| Median | 9.0% | 13.7% |
| Interquartile 25% (IQ1) | 8.1% | 12.6% |
| Interquartile 75% (IQ3) | 10.3% | 20.9% |
| Interquartile Range (IQR) | 2.2% | 8.3% |
| Standard Deviation (Sample) | 3.8% | 9.9% |
| Standard Deviation (Population) | 3.8% | 9.9% |
Similar Demographics by Disability
Demographics Similar to Immigrants from Eastern Asia by Disability
In terms of disability, the demographic groups most similar to Immigrants from Eastern Asia are Immigrants from Israel (10.1%, a difference of 0.21%), Iranian (10.1%, a difference of 0.46%), Immigrants from China (10.1%, a difference of 0.47%), Immigrants from Korea (10.2%, a difference of 0.60%), and Okinawan (10.3%, a difference of 0.91%).
| Demographics | Rating | Rank | Disability |
| Immigrants | South Central Asia | 100.0 /100 | #6 | Exceptional 9.9% |
| Immigrants | Singapore | 100.0 /100 | #7 | Exceptional 10.0% |
| Bolivians | 100.0 /100 | #8 | Exceptional 10.0% |
| Immigrants | Hong Kong | 100.0 /100 | #9 | Exceptional 10.0% |
| Immigrants | China | 100.0 /100 | #10 | Exceptional 10.1% |
| Iranians | 100.0 /100 | #11 | Exceptional 10.1% |
| Immigrants | Israel | 100.0 /100 | #12 | Exceptional 10.1% |
| Immigrants | Eastern Asia | 100.0 /100 | #13 | Exceptional 10.2% |
| Immigrants | Korea | 100.0 /100 | #14 | Exceptional 10.2% |
| Okinawans | 100.0 /100 | #15 | Exceptional 10.3% |
| Indians (Asian) | 100.0 /100 | #16 | Exceptional 10.3% |
| Immigrants | Iran | 100.0 /100 | #17 | Exceptional 10.3% |
| Burmese | 100.0 /100 | #18 | Exceptional 10.4% |
| Immigrants | Pakistan | 100.0 /100 | #19 | Exceptional 10.4% |
| Immigrants | Venezuela | 100.0 /100 | #20 | Exceptional 10.4% |
Demographics Similar to English by Disability
In terms of disability, the demographic groups most similar to English are Crow (12.9%, a difference of 0.38%), Welsh (12.9%, a difference of 0.39%), African (13.0%, a difference of 0.41%), White/Caucasian (13.0%, a difference of 0.43%), and Slovak (13.0%, a difference of 0.44%).
| Demographics | Rating | Rank | Disability |
| Fijians | 0.0 /100 | #279 | Tragic 12.8% |
| Spanish | 0.0 /100 | #280 | Tragic 12.8% |
| Immigrants | Portugal | 0.0 /100 | #281 | Tragic 12.9% |
| Scottish | 0.0 /100 | #282 | Tragic 12.9% |
| Irish | 0.0 /100 | #283 | Tragic 12.9% |
| Welsh | 0.0 /100 | #284 | Tragic 12.9% |
| Crow | 0.0 /100 | #285 | Tragic 12.9% |
| English | 0.0 /100 | #286 | Tragic 13.0% |
| Africans | 0.0 /100 | #287 | Tragic 13.0% |
| Whites/Caucasians | 0.0 /100 | #288 | Tragic 13.0% |
| Slovaks | 0.0 /100 | #289 | Tragic 13.0% |
| Cheyenne | 0.0 /100 | #290 | Tragic 13.0% |
| Yaqui | 0.0 /100 | #291 | Tragic 13.1% |
| Aleuts | 0.0 /100 | #292 | Tragic 13.1% |
| Marshallese | 0.0 /100 | #293 | Tragic 13.1% |