Immigrants from Eastern Asia vs Immigrants from Africa Disability
COMPARE
Immigrants from Eastern Asia
Immigrants from Africa
Disability
Disability Comparison
Immigrants from Eastern Asia
Immigrants from Africa
10.2%
DISABILITY
100.0/ 100
METRIC RATING
13th/ 347
METRIC RANK
11.4%
DISABILITY
89.3/ 100
METRIC RATING
132nd/ 347
METRIC RANK
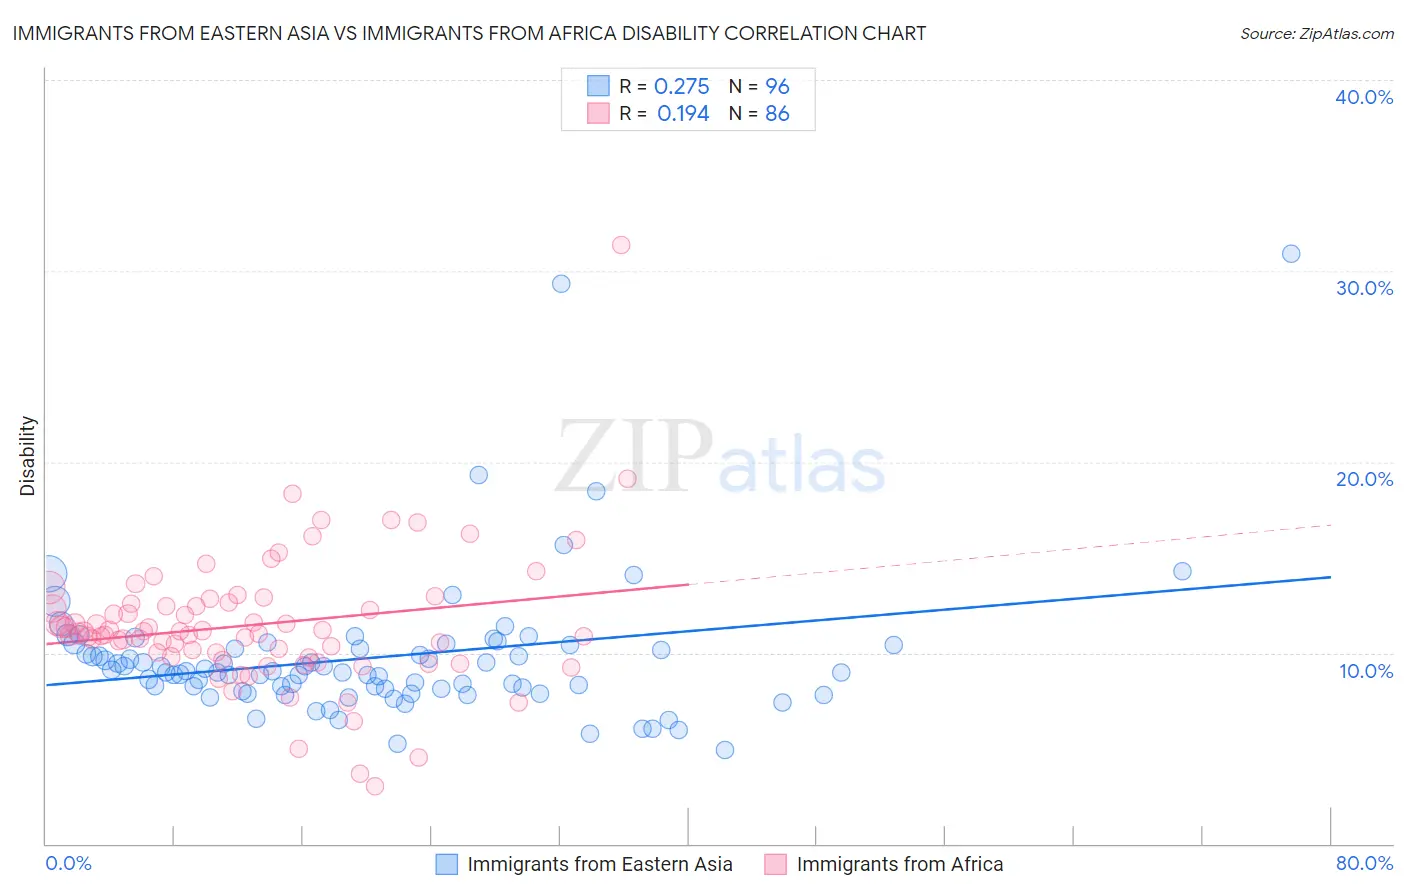
Immigrants from Eastern Asia vs Immigrants from Africa Disability Correlation Chart
The statistical analysis conducted on geographies consisting of 499,894,930 people shows a weak positive correlation between the proportion of Immigrants from Eastern Asia and percentage of population with a disability in the United States with a correlation coefficient (R) of 0.275 and weighted average of 10.2%. Similarly, the statistical analysis conducted on geographies consisting of 469,357,699 people shows a poor positive correlation between the proportion of Immigrants from Africa and percentage of population with a disability in the United States with a correlation coefficient (R) of 0.194 and weighted average of 11.4%, a difference of 12.4%.
Disability Correlation Summary
| Measurement | Immigrants from Eastern Asia | Immigrants from Africa |
| Minimum | 4.9% | 3.0% |
| Maximum | 30.9% | 31.3% |
| Range | 26.0% | 28.3% |
| Mean | 9.8% | 11.5% |
| Median | 9.0% | 11.1% |
| Interquartile 25% (IQ1) | 8.1% | 9.8% |
| Interquartile 75% (IQ3) | 10.3% | 12.6% |
| Interquartile Range (IQR) | 2.2% | 2.8% |
| Standard Deviation (Sample) | 3.8% | 3.6% |
| Standard Deviation (Population) | 3.8% | 3.6% |
Similar Demographics by Disability
Demographics Similar to Immigrants from Eastern Asia by Disability
In terms of disability, the demographic groups most similar to Immigrants from Eastern Asia are Immigrants from Israel (10.1%, a difference of 0.21%), Iranian (10.1%, a difference of 0.46%), Immigrants from China (10.1%, a difference of 0.47%), Immigrants from Korea (10.2%, a difference of 0.60%), and Okinawan (10.3%, a difference of 0.91%).
| Demographics | Rating | Rank | Disability |
| Immigrants | South Central Asia | 100.0 /100 | #6 | Exceptional 9.9% |
| Immigrants | Singapore | 100.0 /100 | #7 | Exceptional 10.0% |
| Bolivians | 100.0 /100 | #8 | Exceptional 10.0% |
| Immigrants | Hong Kong | 100.0 /100 | #9 | Exceptional 10.0% |
| Immigrants | China | 100.0 /100 | #10 | Exceptional 10.1% |
| Iranians | 100.0 /100 | #11 | Exceptional 10.1% |
| Immigrants | Israel | 100.0 /100 | #12 | Exceptional 10.1% |
| Immigrants | Eastern Asia | 100.0 /100 | #13 | Exceptional 10.2% |
| Immigrants | Korea | 100.0 /100 | #14 | Exceptional 10.2% |
| Okinawans | 100.0 /100 | #15 | Exceptional 10.3% |
| Indians (Asian) | 100.0 /100 | #16 | Exceptional 10.3% |
| Immigrants | Iran | 100.0 /100 | #17 | Exceptional 10.3% |
| Burmese | 100.0 /100 | #18 | Exceptional 10.4% |
| Immigrants | Pakistan | 100.0 /100 | #19 | Exceptional 10.4% |
| Immigrants | Venezuela | 100.0 /100 | #20 | Exceptional 10.4% |
Demographics Similar to Immigrants from Africa by Disability
In terms of disability, the demographic groups most similar to Immigrants from Africa are Arab (11.4%, a difference of 0.030%), Immigrants from Croatia (11.4%, a difference of 0.060%), Latvian (11.4%, a difference of 0.070%), Immigrants from Guyana (11.4%, a difference of 0.11%), and Macedonian (11.4%, a difference of 0.12%).
| Demographics | Rating | Rank | Disability |
| Costa Ricans | 91.9 /100 | #125 | Exceptional 11.4% |
| Immigrants | Latvia | 90.9 /100 | #126 | Exceptional 11.4% |
| Immigrants | Italy | 90.4 /100 | #127 | Exceptional 11.4% |
| Immigrants | Europe | 90.4 /100 | #128 | Exceptional 11.4% |
| Macedonians | 90.3 /100 | #129 | Exceptional 11.4% |
| Latvians | 89.8 /100 | #130 | Excellent 11.4% |
| Immigrants | Croatia | 89.8 /100 | #131 | Excellent 11.4% |
| Immigrants | Africa | 89.3 /100 | #132 | Excellent 11.4% |
| Arabs | 89.1 /100 | #133 | Excellent 11.4% |
| Immigrants | Guyana | 88.3 /100 | #134 | Excellent 11.4% |
| Ugandans | 87.9 /100 | #135 | Excellent 11.4% |
| Immigrants | St. Vincent and the Grenadines | 87.8 /100 | #136 | Excellent 11.4% |
| Kenyans | 87.1 /100 | #137 | Excellent 11.5% |
| New Zealanders | 87.0 /100 | #138 | Excellent 11.5% |
| Ghanaians | 87.0 /100 | #139 | Excellent 11.5% |