Kenyan vs English Disability
COMPARE
Kenyan
English
Disability
Disability Comparison
Kenyans
English
11.5%
DISABILITY
87.1/ 100
METRIC RATING
137th/ 347
METRIC RANK
13.0%
DISABILITY
0.0/ 100
METRIC RATING
286th/ 347
METRIC RANK
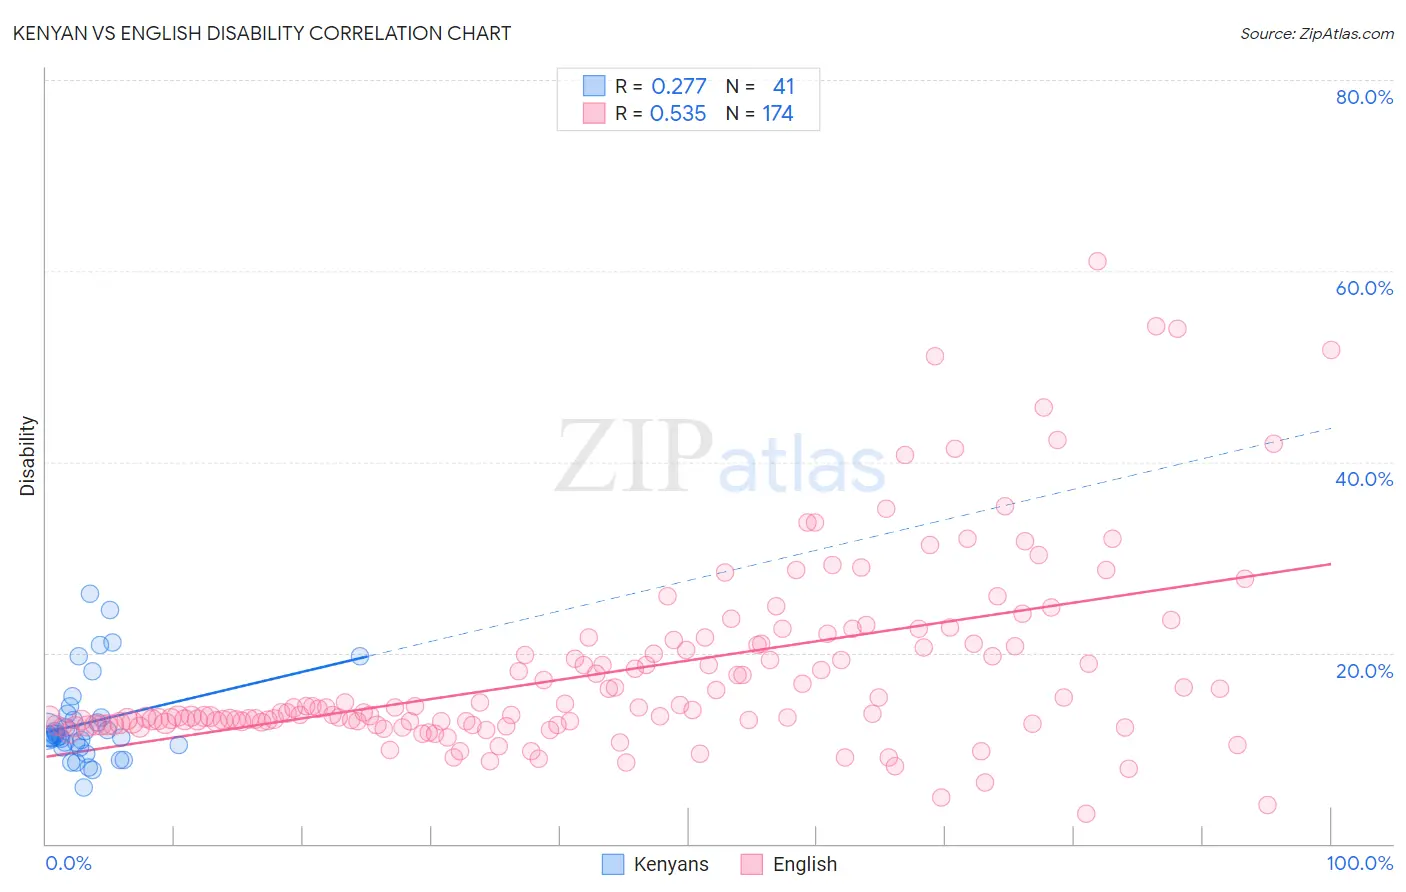
Kenyan vs English Disability Correlation Chart
The statistical analysis conducted on geographies consisting of 168,214,038 people shows a weak positive correlation between the proportion of Kenyans and percentage of population with a disability in the United States with a correlation coefficient (R) of 0.277 and weighted average of 11.5%. Similarly, the statistical analysis conducted on geographies consisting of 579,766,165 people shows a substantial positive correlation between the proportion of English and percentage of population with a disability in the United States with a correlation coefficient (R) of 0.535 and weighted average of 13.0%, a difference of 13.1%.
Disability Correlation Summary
| Measurement | Kenyan | English |
| Minimum | 5.9% | 3.2% |
| Maximum | 26.2% | 61.0% |
| Range | 20.3% | 57.9% |
| Mean | 12.7% | 18.0% |
| Median | 11.3% | 13.7% |
| Interquartile 25% (IQ1) | 10.2% | 12.6% |
| Interquartile 75% (IQ3) | 13.4% | 20.9% |
| Interquartile Range (IQR) | 3.2% | 8.3% |
| Standard Deviation (Sample) | 4.5% | 9.9% |
| Standard Deviation (Population) | 4.5% | 9.9% |
Similar Demographics by Disability
Demographics Similar to Kenyans by Disability
In terms of disability, the demographic groups most similar to Kenyans are New Zealander (11.5%, a difference of 0.010%), Ghanaian (11.5%, a difference of 0.010%), Russian (11.5%, a difference of 0.030%), Immigrants from St. Vincent and the Grenadines (11.4%, a difference of 0.070%), and Ugandan (11.4%, a difference of 0.080%).
| Demographics | Rating | Rank | Disability |
| Latvians | 89.8 /100 | #130 | Excellent 11.4% |
| Immigrants | Croatia | 89.8 /100 | #131 | Excellent 11.4% |
| Immigrants | Africa | 89.3 /100 | #132 | Excellent 11.4% |
| Arabs | 89.1 /100 | #133 | Excellent 11.4% |
| Immigrants | Guyana | 88.3 /100 | #134 | Excellent 11.4% |
| Ugandans | 87.9 /100 | #135 | Excellent 11.4% |
| Immigrants | St. Vincent and the Grenadines | 87.8 /100 | #136 | Excellent 11.4% |
| Kenyans | 87.1 /100 | #137 | Excellent 11.5% |
| New Zealanders | 87.0 /100 | #138 | Excellent 11.5% |
| Ghanaians | 87.0 /100 | #139 | Excellent 11.5% |
| Russians | 86.8 /100 | #140 | Excellent 11.5% |
| Immigrants | Grenada | 86.1 /100 | #141 | Excellent 11.5% |
| Immigrants | Sudan | 85.3 /100 | #142 | Excellent 11.5% |
| Moroccans | 83.3 /100 | #143 | Excellent 11.5% |
| Australians | 82.5 /100 | #144 | Excellent 11.5% |
Demographics Similar to English by Disability
In terms of disability, the demographic groups most similar to English are Crow (12.9%, a difference of 0.38%), Welsh (12.9%, a difference of 0.39%), African (13.0%, a difference of 0.41%), White/Caucasian (13.0%, a difference of 0.43%), and Slovak (13.0%, a difference of 0.44%).
| Demographics | Rating | Rank | Disability |
| Fijians | 0.0 /100 | #279 | Tragic 12.8% |
| Spanish | 0.0 /100 | #280 | Tragic 12.8% |
| Immigrants | Portugal | 0.0 /100 | #281 | Tragic 12.9% |
| Scottish | 0.0 /100 | #282 | Tragic 12.9% |
| Irish | 0.0 /100 | #283 | Tragic 12.9% |
| Welsh | 0.0 /100 | #284 | Tragic 12.9% |
| Crow | 0.0 /100 | #285 | Tragic 12.9% |
| English | 0.0 /100 | #286 | Tragic 13.0% |
| Africans | 0.0 /100 | #287 | Tragic 13.0% |
| Whites/Caucasians | 0.0 /100 | #288 | Tragic 13.0% |
| Slovaks | 0.0 /100 | #289 | Tragic 13.0% |
| Cheyenne | 0.0 /100 | #290 | Tragic 13.0% |
| Yaqui | 0.0 /100 | #291 | Tragic 13.1% |
| Aleuts | 0.0 /100 | #292 | Tragic 13.1% |
| Marshallese | 0.0 /100 | #293 | Tragic 13.1% |