Immigrants from Eastern Asia vs Dominican Disability
COMPARE
Immigrants from Eastern Asia
Dominican
Disability
Disability Comparison
Immigrants from Eastern Asia
Dominicans
10.2%
DISABILITY
100.0/ 100
METRIC RATING
13th/ 347
METRIC RANK
12.7%
DISABILITY
0.0/ 100
METRIC RATING
272nd/ 347
METRIC RANK
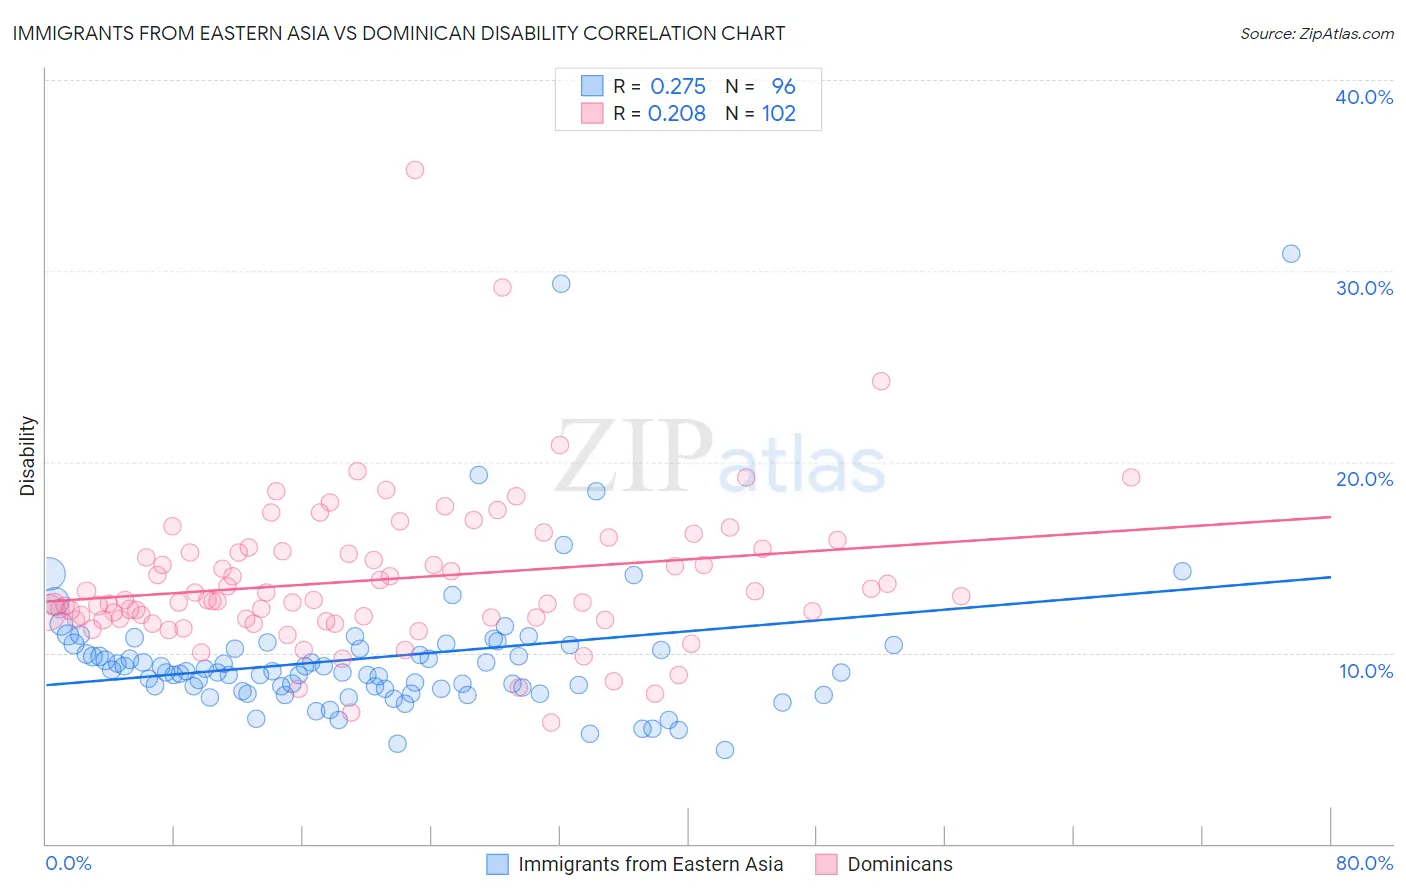
Immigrants from Eastern Asia vs Dominican Disability Correlation Chart
The statistical analysis conducted on geographies consisting of 499,894,930 people shows a weak positive correlation between the proportion of Immigrants from Eastern Asia and percentage of population with a disability in the United States with a correlation coefficient (R) of 0.275 and weighted average of 10.2%. Similarly, the statistical analysis conducted on geographies consisting of 355,062,868 people shows a weak positive correlation between the proportion of Dominicans and percentage of population with a disability in the United States with a correlation coefficient (R) of 0.208 and weighted average of 12.7%, a difference of 24.9%.
Disability Correlation Summary
| Measurement | Immigrants from Eastern Asia | Dominican |
| Minimum | 4.9% | 6.4% |
| Maximum | 30.9% | 35.3% |
| Range | 26.0% | 28.9% |
| Mean | 9.8% | 13.8% |
| Median | 9.0% | 12.8% |
| Interquartile 25% (IQ1) | 8.1% | 11.8% |
| Interquartile 75% (IQ3) | 10.3% | 15.3% |
| Interquartile Range (IQR) | 2.2% | 3.5% |
| Standard Deviation (Sample) | 3.8% | 4.0% |
| Standard Deviation (Population) | 3.8% | 4.0% |
Similar Demographics by Disability
Demographics Similar to Immigrants from Eastern Asia by Disability
In terms of disability, the demographic groups most similar to Immigrants from Eastern Asia are Immigrants from Israel (10.1%, a difference of 0.21%), Iranian (10.1%, a difference of 0.46%), Immigrants from China (10.1%, a difference of 0.47%), Immigrants from Korea (10.2%, a difference of 0.60%), and Okinawan (10.3%, a difference of 0.91%).
| Demographics | Rating | Rank | Disability |
| Immigrants | South Central Asia | 100.0 /100 | #6 | Exceptional 9.9% |
| Immigrants | Singapore | 100.0 /100 | #7 | Exceptional 10.0% |
| Bolivians | 100.0 /100 | #8 | Exceptional 10.0% |
| Immigrants | Hong Kong | 100.0 /100 | #9 | Exceptional 10.0% |
| Immigrants | China | 100.0 /100 | #10 | Exceptional 10.1% |
| Iranians | 100.0 /100 | #11 | Exceptional 10.1% |
| Immigrants | Israel | 100.0 /100 | #12 | Exceptional 10.1% |
| Immigrants | Eastern Asia | 100.0 /100 | #13 | Exceptional 10.2% |
| Immigrants | Korea | 100.0 /100 | #14 | Exceptional 10.2% |
| Okinawans | 100.0 /100 | #15 | Exceptional 10.3% |
| Indians (Asian) | 100.0 /100 | #16 | Exceptional 10.3% |
| Immigrants | Iran | 100.0 /100 | #17 | Exceptional 10.3% |
| Burmese | 100.0 /100 | #18 | Exceptional 10.4% |
| Immigrants | Pakistan | 100.0 /100 | #19 | Exceptional 10.4% |
| Immigrants | Venezuela | 100.0 /100 | #20 | Exceptional 10.4% |
Demographics Similar to Dominicans by Disability
In terms of disability, the demographic groups most similar to Dominicans are Finnish (12.7%, a difference of 0.16%), Immigrants from Yemen (12.6%, a difference of 0.49%), Portuguese (12.6%, a difference of 0.54%), Nepalese (12.8%, a difference of 0.60%), and Sioux (12.8%, a difference of 0.68%).
| Demographics | Rating | Rank | Disability |
| U.S. Virgin Islanders | 0.2 /100 | #265 | Tragic 12.5% |
| Czechoslovakians | 0.2 /100 | #266 | Tragic 12.5% |
| Spaniards | 0.2 /100 | #267 | Tragic 12.5% |
| Bangladeshis | 0.1 /100 | #268 | Tragic 12.6% |
| Immigrants | Dominican Republic | 0.1 /100 | #269 | Tragic 12.6% |
| Portuguese | 0.1 /100 | #270 | Tragic 12.6% |
| Immigrants | Yemen | 0.1 /100 | #271 | Tragic 12.6% |
| Dominicans | 0.0 /100 | #272 | Tragic 12.7% |
| Finns | 0.0 /100 | #273 | Tragic 12.7% |
| Nepalese | 0.0 /100 | #274 | Tragic 12.8% |
| Sioux | 0.0 /100 | #275 | Tragic 12.8% |
| Hmong | 0.0 /100 | #276 | Tragic 12.8% |
| Dutch | 0.0 /100 | #277 | Tragic 12.8% |
| Germans | 0.0 /100 | #278 | Tragic 12.8% |
| Fijians | 0.0 /100 | #279 | Tragic 12.8% |