Immigrants from Eastern Asia vs Immigrants from Kuwait Disability
COMPARE
Immigrants from Eastern Asia
Immigrants from Kuwait
Disability
Disability Comparison
Immigrants from Eastern Asia
Immigrants from Kuwait
10.2%
DISABILITY
100.0/ 100
METRIC RATING
13th/ 347
METRIC RANK
10.7%
DISABILITY
100.0/ 100
METRIC RATING
33rd/ 347
METRIC RANK
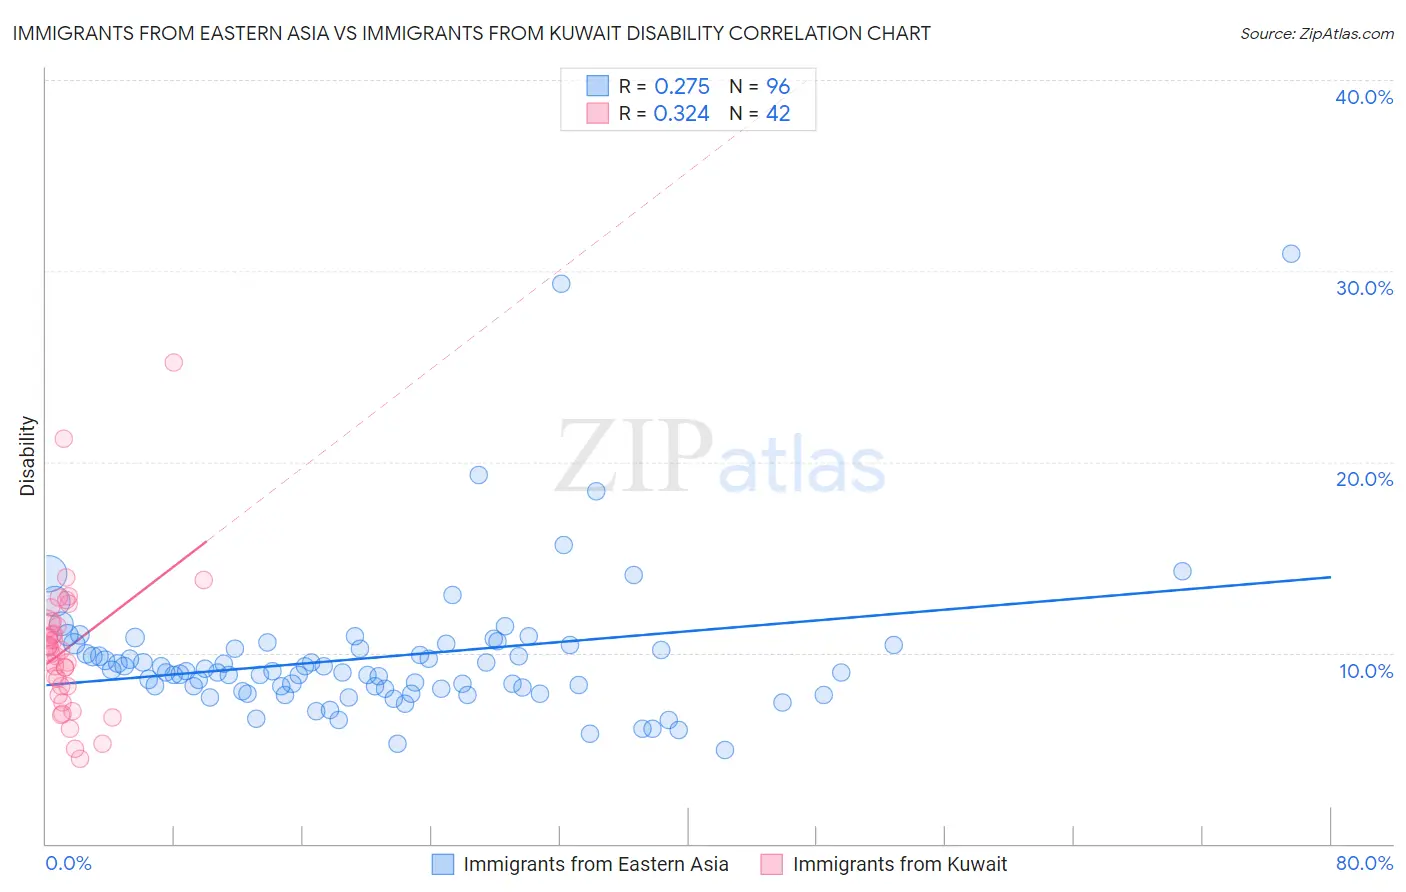
Immigrants from Eastern Asia vs Immigrants from Kuwait Disability Correlation Chart
The statistical analysis conducted on geographies consisting of 499,894,930 people shows a weak positive correlation between the proportion of Immigrants from Eastern Asia and percentage of population with a disability in the United States with a correlation coefficient (R) of 0.275 and weighted average of 10.2%. Similarly, the statistical analysis conducted on geographies consisting of 136,916,630 people shows a mild positive correlation between the proportion of Immigrants from Kuwait and percentage of population with a disability in the United States with a correlation coefficient (R) of 0.324 and weighted average of 10.7%, a difference of 5.1%.
Disability Correlation Summary
| Measurement | Immigrants from Eastern Asia | Immigrants from Kuwait |
| Minimum | 4.9% | 4.4% |
| Maximum | 30.9% | 25.2% |
| Range | 26.0% | 20.8% |
| Mean | 9.8% | 10.3% |
| Median | 9.0% | 10.0% |
| Interquartile 25% (IQ1) | 8.1% | 8.3% |
| Interquartile 75% (IQ3) | 10.3% | 11.5% |
| Interquartile Range (IQR) | 2.2% | 3.2% |
| Standard Deviation (Sample) | 3.8% | 3.8% |
| Standard Deviation (Population) | 3.8% | 3.8% |
Demographics Similar to Immigrants from Eastern Asia and Immigrants from Kuwait by Disability
In terms of disability, the demographic groups most similar to Immigrants from Eastern Asia are Immigrants from Korea (10.2%, a difference of 0.60%), Okinawan (10.3%, a difference of 0.91%), Indian (Asian) (10.3%, a difference of 0.98%), Immigrants from Iran (10.3%, a difference of 1.1%), and Burmese (10.4%, a difference of 2.1%). Similarly, the demographic groups most similar to Immigrants from Kuwait are Paraguayan (10.6%, a difference of 0.25%), Immigrants from Egypt (10.6%, a difference of 0.35%), Immigrants from Turkey (10.6%, a difference of 0.42%), Immigrants from Argentina (10.6%, a difference of 0.58%), and Egyptian (10.6%, a difference of 0.71%).
| Demographics | Rating | Rank | Disability |
| Immigrants | Eastern Asia | 100.0 /100 | #13 | Exceptional 10.2% |
| Immigrants | Korea | 100.0 /100 | #14 | Exceptional 10.2% |
| Okinawans | 100.0 /100 | #15 | Exceptional 10.3% |
| Indians (Asian) | 100.0 /100 | #16 | Exceptional 10.3% |
| Immigrants | Iran | 100.0 /100 | #17 | Exceptional 10.3% |
| Burmese | 100.0 /100 | #18 | Exceptional 10.4% |
| Immigrants | Pakistan | 100.0 /100 | #19 | Exceptional 10.4% |
| Immigrants | Venezuela | 100.0 /100 | #20 | Exceptional 10.4% |
| Asians | 100.0 /100 | #21 | Exceptional 10.4% |
| Immigrants | Sri Lanka | 100.0 /100 | #22 | Exceptional 10.5% |
| Immigrants | Asia | 100.0 /100 | #23 | Exceptional 10.5% |
| Venezuelans | 100.0 /100 | #24 | Exceptional 10.5% |
| Immigrants | Malaysia | 100.0 /100 | #25 | Exceptional 10.6% |
| Argentineans | 100.0 /100 | #26 | Exceptional 10.6% |
| Cypriots | 100.0 /100 | #27 | Exceptional 10.6% |
| Egyptians | 100.0 /100 | #28 | Exceptional 10.6% |
| Immigrants | Argentina | 100.0 /100 | #29 | Exceptional 10.6% |
| Immigrants | Turkey | 100.0 /100 | #30 | Exceptional 10.6% |
| Immigrants | Egypt | 100.0 /100 | #31 | Exceptional 10.6% |
| Paraguayans | 100.0 /100 | #32 | Exceptional 10.6% |
| Immigrants | Kuwait | 100.0 /100 | #33 | Exceptional 10.7% |