Immigrants from Eastern Asia vs Immigrants from Canada Disability
COMPARE
Immigrants from Eastern Asia
Immigrants from Canada
Disability
Disability Comparison
Immigrants from Eastern Asia
Immigrants from Canada
10.2%
DISABILITY
100.0/ 100
METRIC RATING
13th/ 347
METRIC RANK
12.1%
DISABILITY
6.1/ 100
METRIC RATING
215th/ 347
METRIC RANK
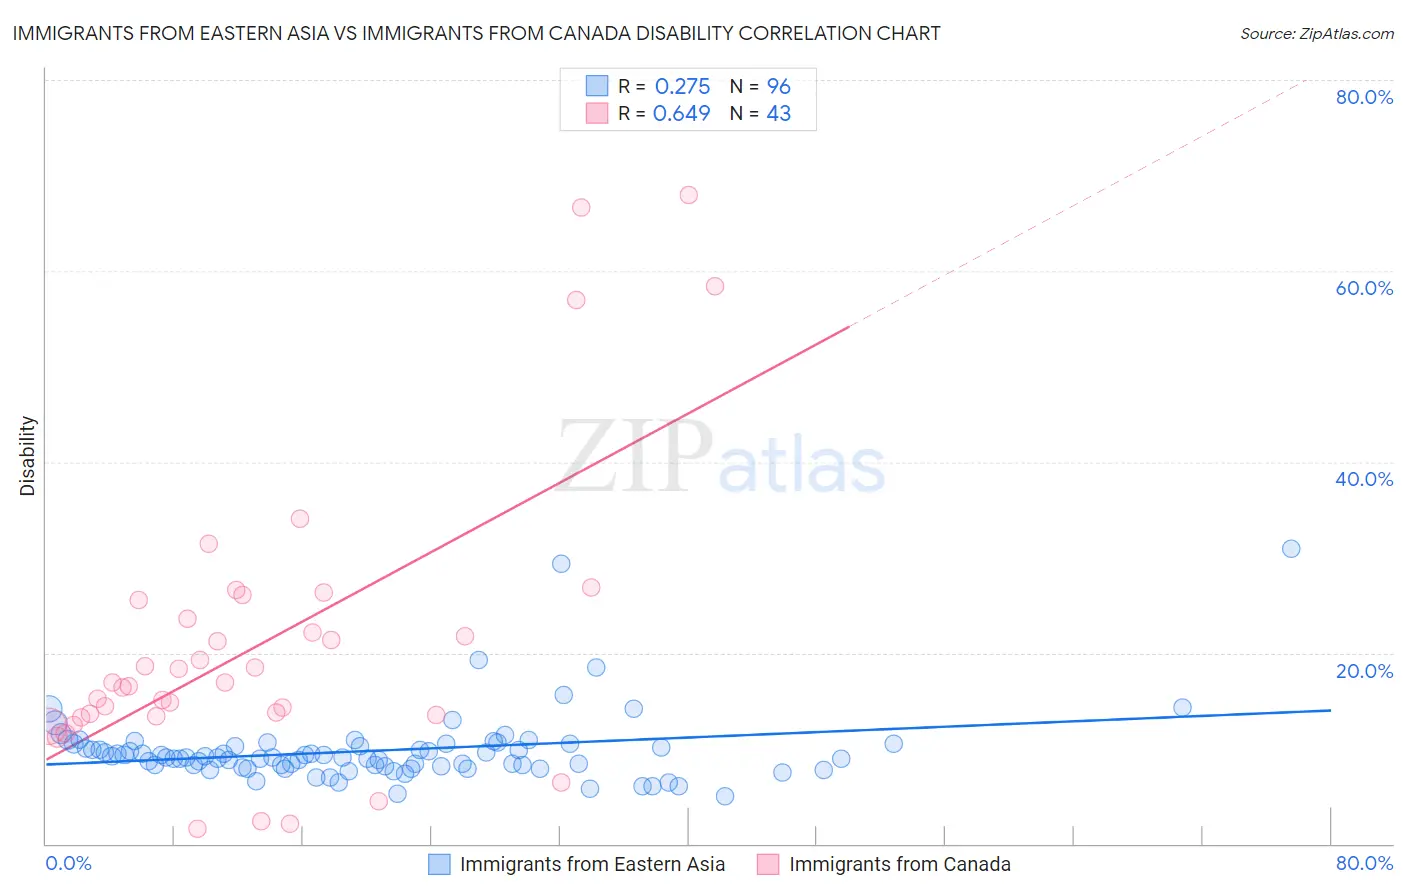
Immigrants from Eastern Asia vs Immigrants from Canada Disability Correlation Chart
The statistical analysis conducted on geographies consisting of 499,894,930 people shows a weak positive correlation between the proportion of Immigrants from Eastern Asia and percentage of population with a disability in the United States with a correlation coefficient (R) of 0.275 and weighted average of 10.2%. Similarly, the statistical analysis conducted on geographies consisting of 459,374,446 people shows a significant positive correlation between the proportion of Immigrants from Canada and percentage of population with a disability in the United States with a correlation coefficient (R) of 0.649 and weighted average of 12.1%, a difference of 18.6%.
Disability Correlation Summary
| Measurement | Immigrants from Eastern Asia | Immigrants from Canada |
| Minimum | 4.9% | 1.6% |
| Maximum | 30.9% | 68.0% |
| Range | 26.0% | 66.4% |
| Mean | 9.8% | 21.0% |
| Median | 9.0% | 16.9% |
| Interquartile 25% (IQ1) | 8.1% | 13.3% |
| Interquartile 75% (IQ3) | 10.3% | 25.6% |
| Interquartile Range (IQR) | 2.2% | 12.2% |
| Standard Deviation (Sample) | 3.8% | 15.3% |
| Standard Deviation (Population) | 3.8% | 15.2% |
Similar Demographics by Disability
Demographics Similar to Immigrants from Eastern Asia by Disability
In terms of disability, the demographic groups most similar to Immigrants from Eastern Asia are Immigrants from Israel (10.1%, a difference of 0.21%), Iranian (10.1%, a difference of 0.46%), Immigrants from China (10.1%, a difference of 0.47%), Immigrants from Korea (10.2%, a difference of 0.60%), and Okinawan (10.3%, a difference of 0.91%).
| Demographics | Rating | Rank | Disability |
| Immigrants | South Central Asia | 100.0 /100 | #6 | Exceptional 9.9% |
| Immigrants | Singapore | 100.0 /100 | #7 | Exceptional 10.0% |
| Bolivians | 100.0 /100 | #8 | Exceptional 10.0% |
| Immigrants | Hong Kong | 100.0 /100 | #9 | Exceptional 10.0% |
| Immigrants | China | 100.0 /100 | #10 | Exceptional 10.1% |
| Iranians | 100.0 /100 | #11 | Exceptional 10.1% |
| Immigrants | Israel | 100.0 /100 | #12 | Exceptional 10.1% |
| Immigrants | Eastern Asia | 100.0 /100 | #13 | Exceptional 10.2% |
| Immigrants | Korea | 100.0 /100 | #14 | Exceptional 10.2% |
| Okinawans | 100.0 /100 | #15 | Exceptional 10.3% |
| Indians (Asian) | 100.0 /100 | #16 | Exceptional 10.3% |
| Immigrants | Iran | 100.0 /100 | #17 | Exceptional 10.3% |
| Burmese | 100.0 /100 | #18 | Exceptional 10.4% |
| Immigrants | Pakistan | 100.0 /100 | #19 | Exceptional 10.4% |
| Immigrants | Venezuela | 100.0 /100 | #20 | Exceptional 10.4% |
Demographics Similar to Immigrants from Canada by Disability
In terms of disability, the demographic groups most similar to Immigrants from Canada are Immigrants from Somalia (12.0%, a difference of 0.13%), Panamanian (12.1%, a difference of 0.15%), Immigrants from North America (12.1%, a difference of 0.16%), Austrian (12.0%, a difference of 0.18%), and Immigrants from Iraq (12.0%, a difference of 0.18%).
| Demographics | Rating | Rank | Disability |
| Immigrants | Caribbean | 9.1 /100 | #208 | Tragic 12.0% |
| Danes | 8.7 /100 | #209 | Tragic 12.0% |
| Czechs | 7.9 /100 | #210 | Tragic 12.0% |
| Immigrants | Cambodia | 7.3 /100 | #211 | Tragic 12.0% |
| Austrians | 7.2 /100 | #212 | Tragic 12.0% |
| Immigrants | Iraq | 7.1 /100 | #213 | Tragic 12.0% |
| Immigrants | Somalia | 6.8 /100 | #214 | Tragic 12.0% |
| Immigrants | Canada | 6.1 /100 | #215 | Tragic 12.1% |
| Panamanians | 5.4 /100 | #216 | Tragic 12.1% |
| Immigrants | North America | 5.3 /100 | #217 | Tragic 12.1% |
| Immigrants | Jamaica | 5.0 /100 | #218 | Tragic 12.1% |
| Croatians | 4.9 /100 | #219 | Tragic 12.1% |
| Immigrants | Bahamas | 4.7 /100 | #220 | Tragic 12.1% |
| Northern Europeans | 4.2 /100 | #221 | Tragic 12.1% |
| Spanish American Indians | 4.1 /100 | #222 | Tragic 12.1% |