Immigrants from Eastern Asia vs Immigrants from Northern Africa Disability
COMPARE
Immigrants from Eastern Asia
Immigrants from Northern Africa
Disability
Disability Comparison
Immigrants from Eastern Asia
Immigrants from Northern Africa
10.2%
DISABILITY
100.0/ 100
METRIC RATING
13th/ 347
METRIC RANK
10.9%
DISABILITY
99.7/ 100
METRIC RATING
62nd/ 347
METRIC RANK
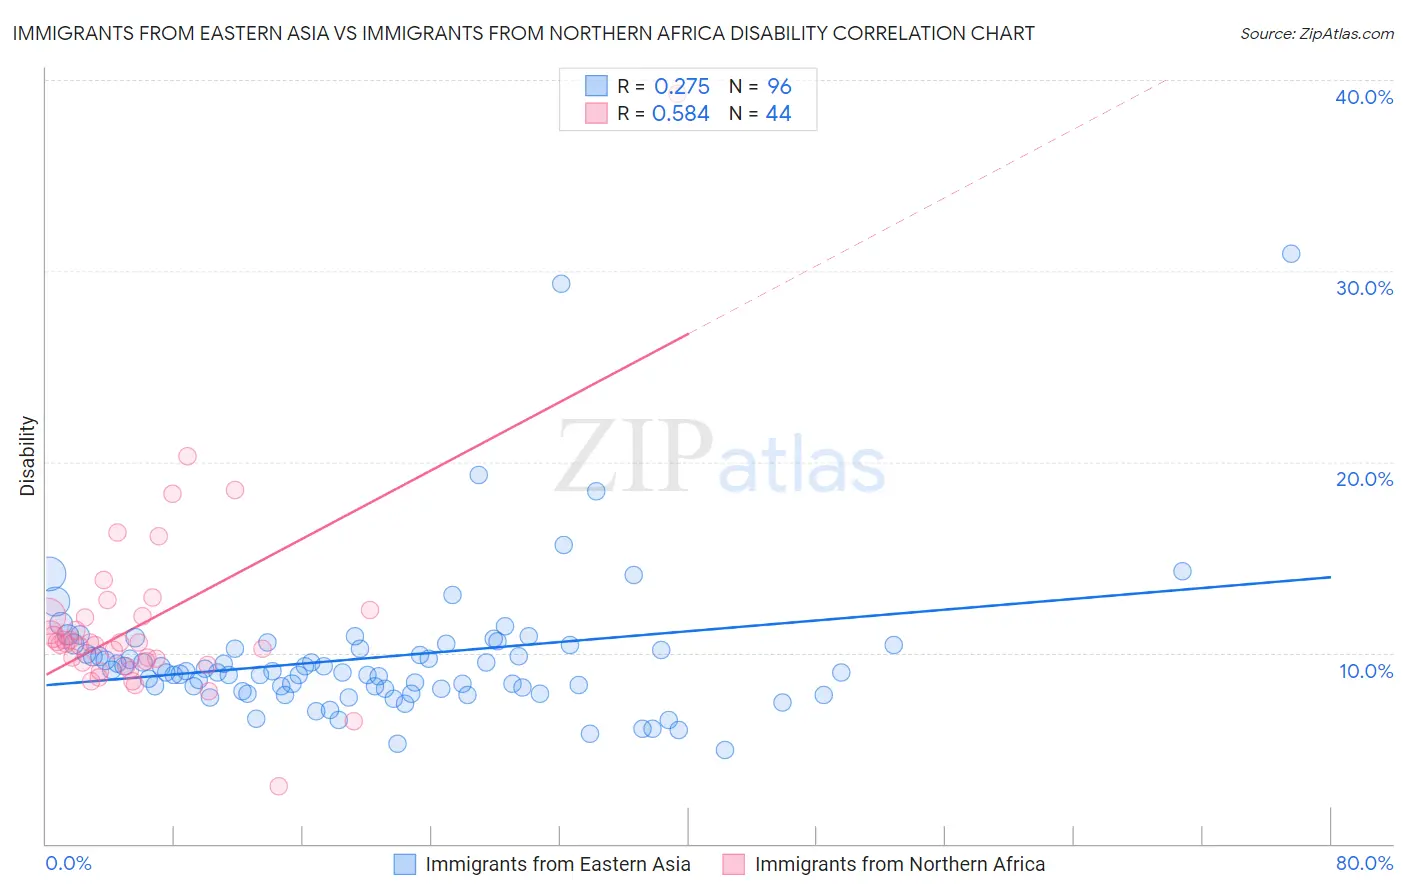
Immigrants from Eastern Asia vs Immigrants from Northern Africa Disability Correlation Chart
The statistical analysis conducted on geographies consisting of 499,894,930 people shows a weak positive correlation between the proportion of Immigrants from Eastern Asia and percentage of population with a disability in the United States with a correlation coefficient (R) of 0.275 and weighted average of 10.2%. Similarly, the statistical analysis conducted on geographies consisting of 321,190,304 people shows a substantial positive correlation between the proportion of Immigrants from Northern Africa and percentage of population with a disability in the United States with a correlation coefficient (R) of 0.584 and weighted average of 10.9%, a difference of 7.8%.
Disability Correlation Summary
| Measurement | Immigrants from Eastern Asia | Immigrants from Northern Africa |
| Minimum | 4.9% | 3.0% |
| Maximum | 30.9% | 39.3% |
| Range | 26.0% | 36.3% |
| Mean | 9.8% | 11.6% |
| Median | 9.0% | 10.5% |
| Interquartile 25% (IQ1) | 8.1% | 9.4% |
| Interquartile 75% (IQ3) | 10.3% | 11.9% |
| Interquartile Range (IQR) | 2.2% | 2.5% |
| Standard Deviation (Sample) | 3.8% | 5.3% |
| Standard Deviation (Population) | 3.8% | 5.2% |
Similar Demographics by Disability
Demographics Similar to Immigrants from Eastern Asia by Disability
In terms of disability, the demographic groups most similar to Immigrants from Eastern Asia are Immigrants from Israel (10.1%, a difference of 0.21%), Iranian (10.1%, a difference of 0.46%), Immigrants from China (10.1%, a difference of 0.47%), Immigrants from Korea (10.2%, a difference of 0.60%), and Okinawan (10.3%, a difference of 0.91%).
| Demographics | Rating | Rank | Disability |
| Immigrants | South Central Asia | 100.0 /100 | #6 | Exceptional 9.9% |
| Immigrants | Singapore | 100.0 /100 | #7 | Exceptional 10.0% |
| Bolivians | 100.0 /100 | #8 | Exceptional 10.0% |
| Immigrants | Hong Kong | 100.0 /100 | #9 | Exceptional 10.0% |
| Immigrants | China | 100.0 /100 | #10 | Exceptional 10.1% |
| Iranians | 100.0 /100 | #11 | Exceptional 10.1% |
| Immigrants | Israel | 100.0 /100 | #12 | Exceptional 10.1% |
| Immigrants | Eastern Asia | 100.0 /100 | #13 | Exceptional 10.2% |
| Immigrants | Korea | 100.0 /100 | #14 | Exceptional 10.2% |
| Okinawans | 100.0 /100 | #15 | Exceptional 10.3% |
| Indians (Asian) | 100.0 /100 | #16 | Exceptional 10.3% |
| Immigrants | Iran | 100.0 /100 | #17 | Exceptional 10.3% |
| Burmese | 100.0 /100 | #18 | Exceptional 10.4% |
| Immigrants | Pakistan | 100.0 /100 | #19 | Exceptional 10.4% |
| Immigrants | Venezuela | 100.0 /100 | #20 | Exceptional 10.4% |
Demographics Similar to Immigrants from Northern Africa by Disability
In terms of disability, the demographic groups most similar to Immigrants from Northern Africa are Immigrants from Eritrea (11.0%, a difference of 0.020%), Immigrants from Bulgaria (10.9%, a difference of 0.040%), Zimbabwean (10.9%, a difference of 0.10%), Immigrants from Colombia (10.9%, a difference of 0.19%), and Immigrants from Sweden (11.0%, a difference of 0.20%).
| Demographics | Rating | Rank | Disability |
| Immigrants | El Salvador | 99.8 /100 | #55 | Exceptional 10.9% |
| Immigrants | Lithuania | 99.8 /100 | #56 | Exceptional 10.9% |
| Salvadorans | 99.8 /100 | #57 | Exceptional 10.9% |
| Immigrants | South America | 99.8 /100 | #58 | Exceptional 10.9% |
| Immigrants | Colombia | 99.7 /100 | #59 | Exceptional 10.9% |
| Zimbabweans | 99.7 /100 | #60 | Exceptional 10.9% |
| Immigrants | Bulgaria | 99.7 /100 | #61 | Exceptional 10.9% |
| Immigrants | Northern Africa | 99.7 /100 | #62 | Exceptional 10.9% |
| Immigrants | Eritrea | 99.7 /100 | #63 | Exceptional 11.0% |
| Immigrants | Sweden | 99.6 /100 | #64 | Exceptional 11.0% |
| Bulgarians | 99.6 /100 | #65 | Exceptional 11.0% |
| Laotians | 99.6 /100 | #66 | Exceptional 11.0% |
| Colombians | 99.6 /100 | #67 | Exceptional 11.0% |
| Immigrants | Afghanistan | 99.6 /100 | #68 | Exceptional 11.0% |
| Sri Lankans | 99.5 /100 | #69 | Exceptional 11.0% |