Immigrants from Eastern Asia vs English Family Households
COMPARE
Immigrants from Eastern Asia
English
Family Households
Family Households Comparison
Immigrants from Eastern Asia
English
64.9%
FAMILY HOUSEHOLDS
94.4/ 100
METRIC RATING
119th/ 347
METRIC RANK
65.1%
FAMILY HOUSEHOLDS
97.4/ 100
METRIC RATING
105th/ 347
METRIC RANK
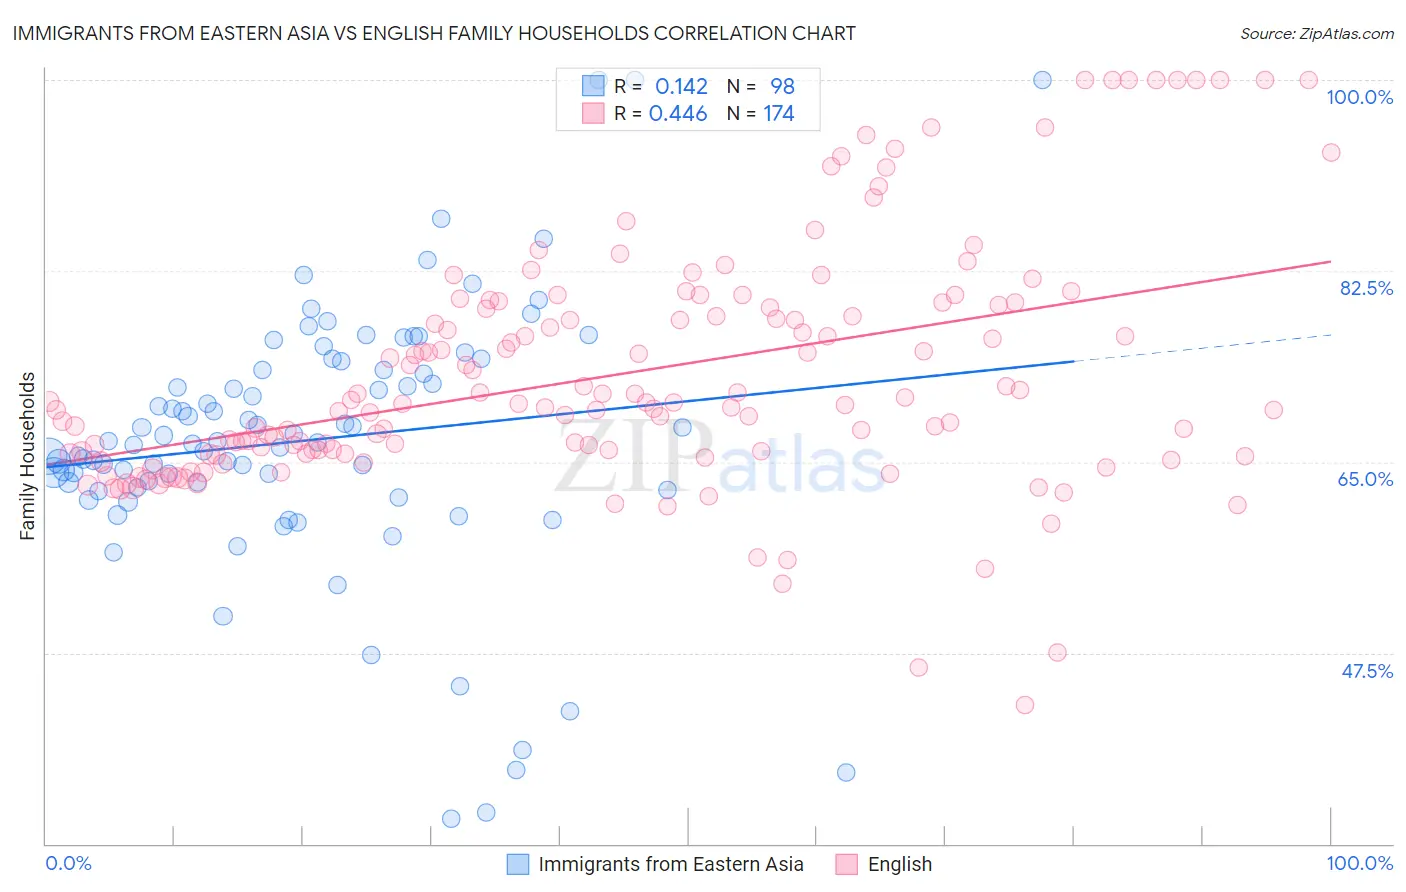
Immigrants from Eastern Asia vs English Family Households Correlation Chart
The statistical analysis conducted on geographies consisting of 499,398,554 people shows a poor positive correlation between the proportion of Immigrants from Eastern Asia and percentage of family households in the United States with a correlation coefficient (R) of 0.142 and weighted average of 64.9%. Similarly, the statistical analysis conducted on geographies consisting of 579,316,298 people shows a moderate positive correlation between the proportion of English and percentage of family households in the United States with a correlation coefficient (R) of 0.446 and weighted average of 65.1%, a difference of 0.26%.
Family Households Correlation Summary
| Measurement | Immigrants from Eastern Asia | English |
| Minimum | 32.3% | 42.7% |
| Maximum | 100.0% | 100.0% |
| Range | 67.7% | 57.3% |
| Mean | 67.0% | 73.0% |
| Median | 66.8% | 70.3% |
| Interquartile 25% (IQ1) | 62.7% | 65.8% |
| Interquartile 75% (IQ3) | 73.5% | 79.2% |
| Interquartile Range (IQR) | 10.8% | 13.5% |
| Standard Deviation (Sample) | 12.2% | 11.1% |
| Standard Deviation (Population) | 12.1% | 11.0% |
Demographics Similar to Immigrants from Eastern Asia and English by Family Households
In terms of family households, the demographic groups most similar to Immigrants from Eastern Asia are Immigrants from Oceania (64.9%, a difference of 0.010%), Hungarian (64.9%, a difference of 0.020%), Dutch (64.9%, a difference of 0.040%), Cherokee (65.0%, a difference of 0.060%), and Hmong (64.9%, a difference of 0.060%). Similarly, the demographic groups most similar to English are White/Caucasian (65.1%, a difference of 0.010%), Alaska Native (65.1%, a difference of 0.010%), Palestinian (65.1%, a difference of 0.020%), Immigrants from Guatemala (65.0%, a difference of 0.060%), and Indian (Asian) (65.1%, a difference of 0.070%).
| Demographics | Rating | Rank | Family Households |
| Immigrants | Sri Lanka | 98.0 /100 | #102 | Exceptional 65.1% |
| Indians (Asian) | 97.9 /100 | #103 | Exceptional 65.1% |
| Spaniards | 97.8 /100 | #104 | Exceptional 65.1% |
| English | 97.4 /100 | #105 | Exceptional 65.1% |
| Whites/Caucasians | 97.3 /100 | #106 | Exceptional 65.1% |
| Alaska Natives | 97.3 /100 | #107 | Exceptional 65.1% |
| Palestinians | 97.2 /100 | #108 | Exceptional 65.1% |
| Immigrants | Guatemala | 96.9 /100 | #109 | Exceptional 65.0% |
| Scandinavians | 96.8 /100 | #110 | Exceptional 65.0% |
| Europeans | 96.8 /100 | #111 | Exceptional 65.0% |
| Immigrants | Jordan | 96.5 /100 | #112 | Exceptional 65.0% |
| Spanish | 96.2 /100 | #113 | Exceptional 65.0% |
| Argentineans | 95.7 /100 | #114 | Exceptional 65.0% |
| Ecuadorians | 95.4 /100 | #115 | Exceptional 65.0% |
| Immigrants | Iraq | 95.4 /100 | #116 | Exceptional 65.0% |
| Cherokee | 95.3 /100 | #117 | Exceptional 65.0% |
| Dutch | 95.1 /100 | #118 | Exceptional 64.9% |
| Immigrants | Eastern Asia | 94.4 /100 | #119 | Exceptional 64.9% |
| Immigrants | Oceania | 94.2 /100 | #120 | Exceptional 64.9% |
| Hungarians | 94.0 /100 | #121 | Exceptional 64.9% |
| Hmong | 93.4 /100 | #122 | Exceptional 64.9% |