Immigrants from Burma/Myanmar vs English Disability
COMPARE
Immigrants from Burma/Myanmar
English
Disability
Disability Comparison
Immigrants from Burma/Myanmar
English
11.8%
DISABILITY
28.5/ 100
METRIC RATING
185th/ 347
METRIC RANK
13.0%
DISABILITY
0.0/ 100
METRIC RATING
286th/ 347
METRIC RANK
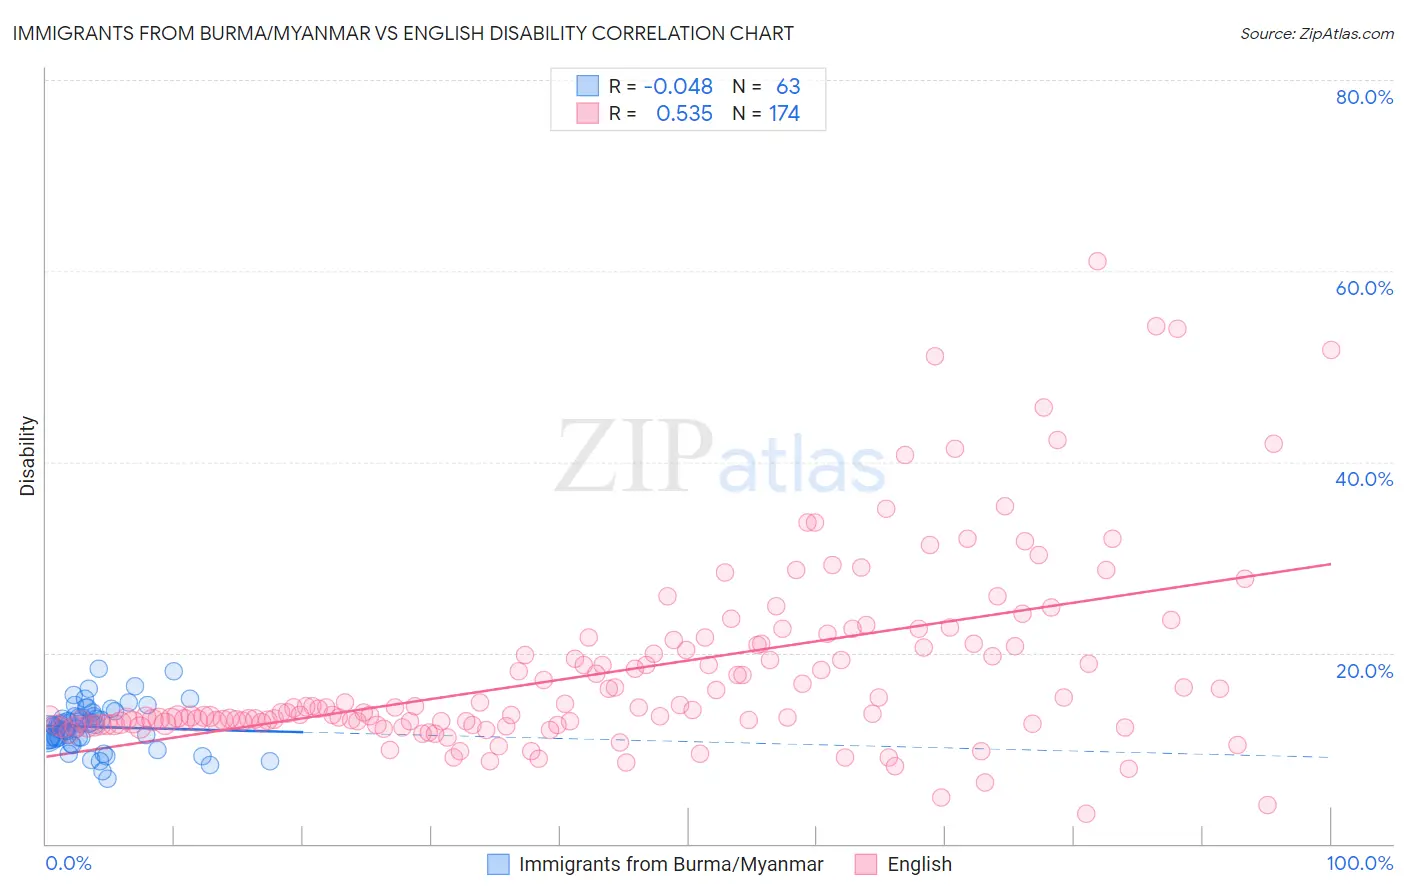
Immigrants from Burma/Myanmar vs English Disability Correlation Chart
The statistical analysis conducted on geographies consisting of 172,347,454 people shows no correlation between the proportion of Immigrants from Burma/Myanmar and percentage of population with a disability in the United States with a correlation coefficient (R) of -0.048 and weighted average of 11.8%. Similarly, the statistical analysis conducted on geographies consisting of 579,766,165 people shows a substantial positive correlation between the proportion of English and percentage of population with a disability in the United States with a correlation coefficient (R) of 0.535 and weighted average of 13.0%, a difference of 9.6%.
Disability Correlation Summary
| Measurement | Immigrants from Burma/Myanmar | English |
| Minimum | 6.8% | 3.2% |
| Maximum | 18.4% | 61.0% |
| Range | 11.6% | 57.9% |
| Mean | 12.2% | 18.0% |
| Median | 12.4% | 13.7% |
| Interquartile 25% (IQ1) | 11.0% | 12.6% |
| Interquartile 75% (IQ3) | 13.4% | 20.9% |
| Interquartile Range (IQR) | 2.4% | 8.3% |
| Standard Deviation (Sample) | 2.3% | 9.9% |
| Standard Deviation (Population) | 2.3% | 9.9% |
Similar Demographics by Disability
Demographics Similar to Immigrants from Burma/Myanmar by Disability
In terms of disability, the demographic groups most similar to Immigrants from Burma/Myanmar are Immigrants from Scotland (11.8%, a difference of 0.010%), Lebanese (11.8%, a difference of 0.030%), Iraqi (11.8%, a difference of 0.080%), Honduran (11.8%, a difference of 0.14%), and Immigrants from Mexico (11.9%, a difference of 0.27%).
| Demographics | Rating | Rank | Disability |
| Greeks | 46.2 /100 | #178 | Average 11.7% |
| Immigrants | Armenia | 41.9 /100 | #179 | Average 11.7% |
| Immigrants | Honduras | 37.8 /100 | #180 | Fair 11.8% |
| Immigrants | Oceania | 34.3 /100 | #181 | Fair 11.8% |
| Icelanders | 34.0 /100 | #182 | Fair 11.8% |
| Hondurans | 31.2 /100 | #183 | Fair 11.8% |
| Iraqis | 30.0 /100 | #184 | Fair 11.8% |
| Immigrants | Burma/Myanmar | 28.5 /100 | #185 | Fair 11.8% |
| Immigrants | Scotland | 28.2 /100 | #186 | Fair 11.8% |
| Lebanese | 27.9 /100 | #187 | Fair 11.8% |
| Immigrants | Mexico | 23.8 /100 | #188 | Fair 11.9% |
| Immigrants | Zaire | 21.8 /100 | #189 | Fair 11.9% |
| Immigrants | West Indies | 21.1 /100 | #190 | Fair 11.9% |
| Ute | 19.5 /100 | #191 | Poor 11.9% |
| Lithuanians | 18.8 /100 | #192 | Poor 11.9% |
Demographics Similar to English by Disability
In terms of disability, the demographic groups most similar to English are Crow (12.9%, a difference of 0.38%), Welsh (12.9%, a difference of 0.39%), African (13.0%, a difference of 0.41%), White/Caucasian (13.0%, a difference of 0.43%), and Slovak (13.0%, a difference of 0.44%).
| Demographics | Rating | Rank | Disability |
| Fijians | 0.0 /100 | #279 | Tragic 12.8% |
| Spanish | 0.0 /100 | #280 | Tragic 12.8% |
| Immigrants | Portugal | 0.0 /100 | #281 | Tragic 12.9% |
| Scottish | 0.0 /100 | #282 | Tragic 12.9% |
| Irish | 0.0 /100 | #283 | Tragic 12.9% |
| Welsh | 0.0 /100 | #284 | Tragic 12.9% |
| Crow | 0.0 /100 | #285 | Tragic 12.9% |
| English | 0.0 /100 | #286 | Tragic 13.0% |
| Africans | 0.0 /100 | #287 | Tragic 13.0% |
| Whites/Caucasians | 0.0 /100 | #288 | Tragic 13.0% |
| Slovaks | 0.0 /100 | #289 | Tragic 13.0% |
| Cheyenne | 0.0 /100 | #290 | Tragic 13.0% |
| Yaqui | 0.0 /100 | #291 | Tragic 13.1% |
| Aleuts | 0.0 /100 | #292 | Tragic 13.1% |
| Marshallese | 0.0 /100 | #293 | Tragic 13.1% |