Immigrants from Eastern Asia vs Lithuanian Ambulatory Disability
COMPARE
Immigrants from Eastern Asia
Lithuanian
Ambulatory Disability
Ambulatory Disability Comparison
Immigrants from Eastern Asia
Lithuanians
5.3%
AMBULATORY DISABILITY
100.0/ 100
METRIC RATING
14th/ 347
METRIC RANK
6.0%
AMBULATORY DISABILITY
81.9/ 100
METRIC RATING
149th/ 347
METRIC RANK
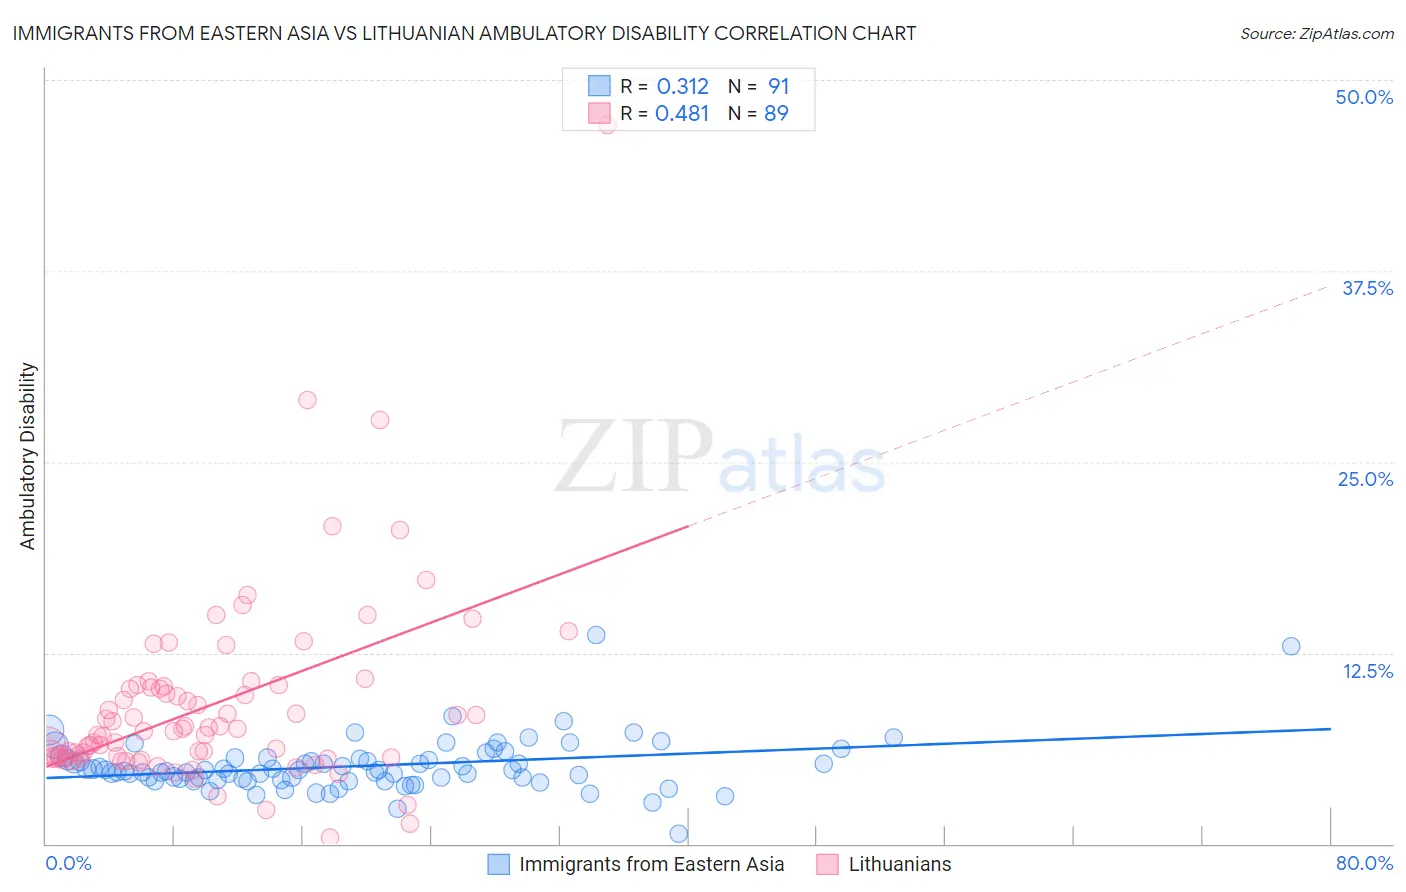
Immigrants from Eastern Asia vs Lithuanian Ambulatory Disability Correlation Chart
The statistical analysis conducted on geographies consisting of 499,616,873 people shows a mild positive correlation between the proportion of Immigrants from Eastern Asia and percentage of population with ambulatory disability in the United States with a correlation coefficient (R) of 0.312 and weighted average of 5.3%. Similarly, the statistical analysis conducted on geographies consisting of 421,829,236 people shows a moderate positive correlation between the proportion of Lithuanians and percentage of population with ambulatory disability in the United States with a correlation coefficient (R) of 0.481 and weighted average of 6.0%, a difference of 13.3%.
Ambulatory Disability Correlation Summary
| Measurement | Immigrants from Eastern Asia | Lithuanian |
| Minimum | 0.61% | 0.40% |
| Maximum | 13.7% | 47.1% |
| Range | 13.1% | 46.7% |
| Mean | 5.1% | 9.0% |
| Median | 4.8% | 7.4% |
| Interquartile 25% (IQ1) | 4.2% | 5.7% |
| Interquartile 75% (IQ3) | 5.5% | 10.3% |
| Interquartile Range (IQR) | 1.3% | 4.6% |
| Standard Deviation (Sample) | 1.8% | 6.3% |
| Standard Deviation (Population) | 1.7% | 6.3% |
Similar Demographics by Ambulatory Disability
Demographics Similar to Immigrants from Eastern Asia by Ambulatory Disability
In terms of ambulatory disability, the demographic groups most similar to Immigrants from Eastern Asia are Burmese (5.3%, a difference of 0.15%), Immigrants from China (5.3%, a difference of 0.33%), Okinawan (5.3%, a difference of 0.65%), Immigrants from Hong Kong (5.3%, a difference of 0.87%), and Immigrants from Korea (5.2%, a difference of 0.96%).
| Demographics | Rating | Rank | Ambulatory Disability |
| Bolivians | 100.0 /100 | #7 | Exceptional 5.1% |
| Immigrants | South Central Asia | 100.0 /100 | #8 | Exceptional 5.1% |
| Iranians | 100.0 /100 | #9 | Exceptional 5.1% |
| Yup'ik | 100.0 /100 | #10 | Exceptional 5.2% |
| Immigrants | Korea | 100.0 /100 | #11 | Exceptional 5.2% |
| Okinawans | 100.0 /100 | #12 | Exceptional 5.3% |
| Burmese | 100.0 /100 | #13 | Exceptional 5.3% |
| Immigrants | Eastern Asia | 100.0 /100 | #14 | Exceptional 5.3% |
| Immigrants | China | 100.0 /100 | #15 | Exceptional 5.3% |
| Immigrants | Hong Kong | 100.0 /100 | #16 | Exceptional 5.3% |
| Immigrants | Ethiopia | 100.0 /100 | #17 | Exceptional 5.4% |
| Immigrants | Sri Lanka | 100.0 /100 | #18 | Exceptional 5.4% |
| Indians (Asian) | 100.0 /100 | #19 | Exceptional 5.4% |
| Ethiopians | 100.0 /100 | #20 | Exceptional 5.4% |
| Immigrants | Kuwait | 100.0 /100 | #21 | Exceptional 5.4% |
Demographics Similar to Lithuanians by Ambulatory Disability
In terms of ambulatory disability, the demographic groups most similar to Lithuanians are Immigrants from Eastern Europe (6.0%, a difference of 0.010%), Maltese (6.0%, a difference of 0.020%), Immigrants from Moldova (6.0%, a difference of 0.050%), Pakistani (6.0%, a difference of 0.060%), and Immigrants from Greece (6.0%, a difference of 0.060%).
| Demographics | Rating | Rank | Ambulatory Disability |
| Immigrants | Philippines | 83.0 /100 | #142 | Excellent 6.0% |
| Romanians | 82.9 /100 | #143 | Excellent 6.0% |
| Macedonians | 82.8 /100 | #144 | Excellent 6.0% |
| Pakistanis | 82.5 /100 | #145 | Excellent 6.0% |
| Immigrants | Greece | 82.5 /100 | #146 | Excellent 6.0% |
| Immigrants | Moldova | 82.4 /100 | #147 | Excellent 6.0% |
| Immigrants | Eastern Europe | 82.0 /100 | #148 | Excellent 6.0% |
| Lithuanians | 81.9 /100 | #149 | Excellent 6.0% |
| Maltese | 81.6 /100 | #150 | Excellent 6.0% |
| Greeks | 79.6 /100 | #151 | Good 6.0% |
| Immigrants | Austria | 78.8 /100 | #152 | Good 6.0% |
| Syrians | 75.5 /100 | #153 | Good 6.0% |
| Immigrants | Croatia | 75.1 /100 | #154 | Good 6.0% |
| Immigrants | Scotland | 72.1 /100 | #155 | Good 6.0% |
| Northern Europeans | 71.8 /100 | #156 | Good 6.0% |