Immigrants from Eastern Asia vs Choctaw In Labor Force | Age 45-54
COMPARE
Immigrants from Eastern Asia
Choctaw
In Labor Force | Age 45-54
In Labor Force | Age 45-54 Comparison
Immigrants from Eastern Asia
Choctaw
83.4%
IN LABOR FORCE | AGE 45-54
96.3/ 100
METRIC RATING
82nd/ 347
METRIC RANK
78.2%
IN LABOR FORCE | AGE 45-54
0.0/ 100
METRIC RATING
325th/ 347
METRIC RANK
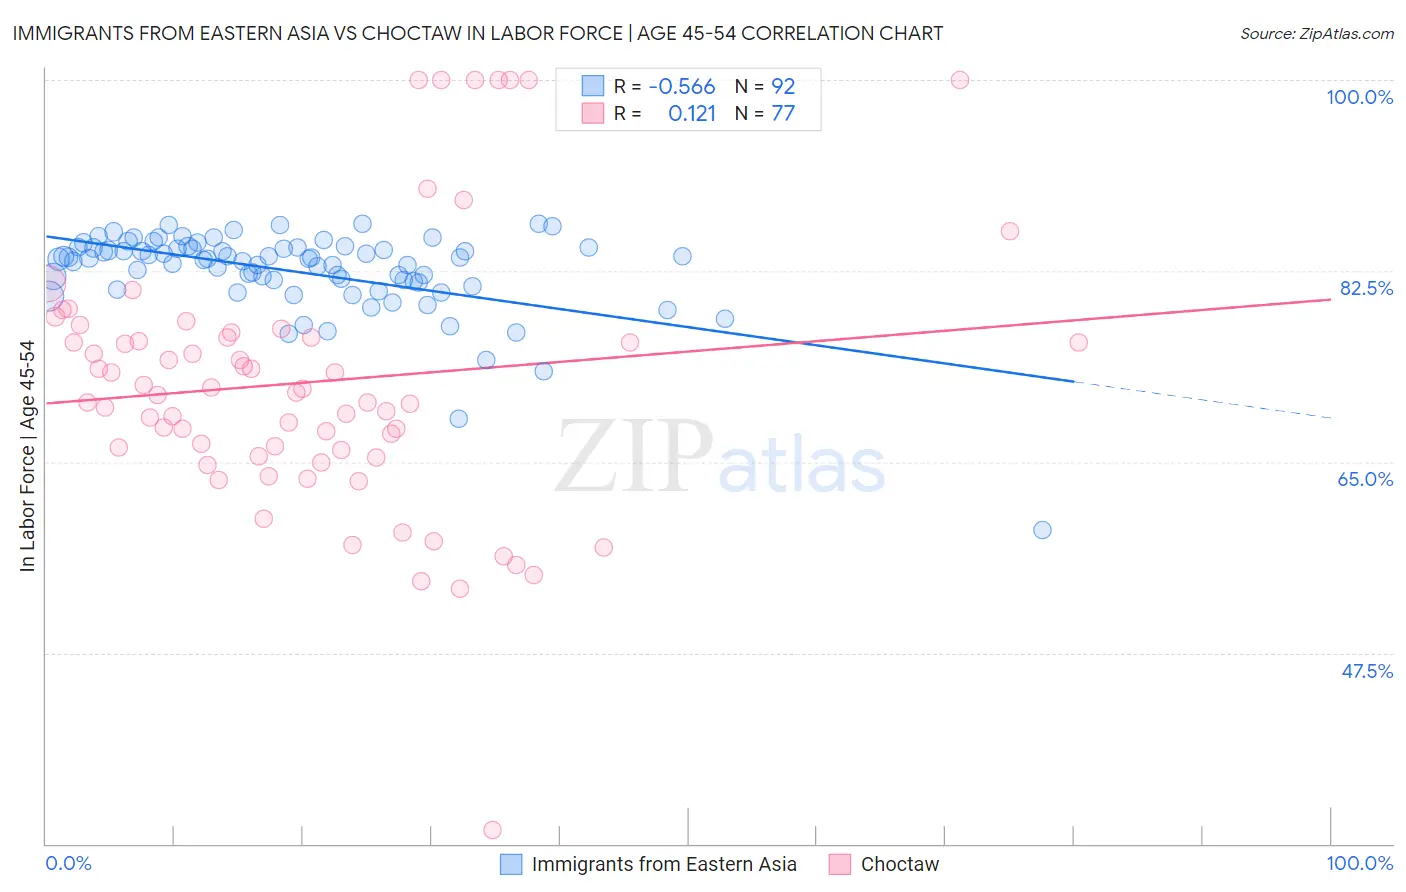
Immigrants from Eastern Asia vs Choctaw In Labor Force | Age 45-54 Correlation Chart
The statistical analysis conducted on geographies consisting of 499,352,896 people shows a substantial negative correlation between the proportion of Immigrants from Eastern Asia and labor force participation rate among population between the ages 45 and 54 in the United States with a correlation coefficient (R) of -0.566 and weighted average of 83.4%. Similarly, the statistical analysis conducted on geographies consisting of 269,621,140 people shows a poor positive correlation between the proportion of Choctaw and labor force participation rate among population between the ages 45 and 54 in the United States with a correlation coefficient (R) of 0.121 and weighted average of 78.2%, a difference of 6.6%.
In Labor Force | Age 45-54 Correlation Summary
| Measurement | Immigrants from Eastern Asia | Choctaw |
| Minimum | 58.8% | 31.3% |
| Maximum | 86.8% | 100.0% |
| Range | 28.0% | 68.7% |
| Mean | 82.4% | 72.4% |
| Median | 83.6% | 71.3% |
| Interquartile 25% (IQ1) | 81.5% | 65.8% |
| Interquartile 75% (IQ3) | 84.6% | 76.6% |
| Interquartile Range (IQR) | 3.1% | 10.8% |
| Standard Deviation (Sample) | 4.0% | 12.4% |
| Standard Deviation (Population) | 4.0% | 12.3% |
Similar Demographics by In Labor Force | Age 45-54
Demographics Similar to Immigrants from Eastern Asia by In Labor Force | Age 45-54
In terms of in labor force | age 45-54, the demographic groups most similar to Immigrants from Eastern Asia are Immigrants from Zimbabwe (83.4%, a difference of 0.0%), Immigrants from Croatia (83.4%, a difference of 0.010%), Jordanian (83.4%, a difference of 0.010%), Immigrants from Egypt (83.4%, a difference of 0.020%), and Belgian (83.4%, a difference of 0.020%).
| Demographics | Rating | Rank | In Labor Force | Age 45-54 |
| Estonians | 96.9 /100 | #75 | Exceptional 83.4% |
| Russians | 96.8 /100 | #76 | Exceptional 83.4% |
| Cubans | 96.7 /100 | #77 | Exceptional 83.4% |
| Immigrants | Egypt | 96.6 /100 | #78 | Exceptional 83.4% |
| Belgians | 96.5 /100 | #79 | Exceptional 83.4% |
| Immigrants | Croatia | 96.5 /100 | #80 | Exceptional 83.4% |
| Jordanians | 96.4 /100 | #81 | Exceptional 83.4% |
| Immigrants | Eastern Asia | 96.3 /100 | #82 | Exceptional 83.4% |
| Immigrants | Zimbabwe | 96.3 /100 | #83 | Exceptional 83.4% |
| Immigrants | Bosnia and Herzegovina | 96.0 /100 | #84 | Exceptional 83.3% |
| Greeks | 95.9 /100 | #85 | Exceptional 83.3% |
| Immigrants | Northern Africa | 95.7 /100 | #86 | Exceptional 83.3% |
| Immigrants | Eastern Europe | 95.6 /100 | #87 | Exceptional 83.3% |
| Immigrants | Asia | 95.6 /100 | #88 | Exceptional 83.3% |
| Indians (Asian) | 95.5 /100 | #89 | Exceptional 83.3% |
Demographics Similar to Choctaw by In Labor Force | Age 45-54
In terms of in labor force | age 45-54, the demographic groups most similar to Choctaw are Seminole (78.1%, a difference of 0.050%), Cajun (78.1%, a difference of 0.050%), Dutch West Indian (78.2%, a difference of 0.090%), Kiowa (78.3%, a difference of 0.11%), and Crow (78.3%, a difference of 0.20%).
| Demographics | Rating | Rank | In Labor Force | Age 45-54 |
| Chickasaw | 0.0 /100 | #318 | Tragic 79.0% |
| Cherokee | 0.0 /100 | #319 | Tragic 79.0% |
| Yaqui | 0.0 /100 | #320 | Tragic 78.9% |
| Yup'ik | 0.0 /100 | #321 | Tragic 78.6% |
| Crow | 0.0 /100 | #322 | Tragic 78.3% |
| Kiowa | 0.0 /100 | #323 | Tragic 78.3% |
| Dutch West Indians | 0.0 /100 | #324 | Tragic 78.2% |
| Choctaw | 0.0 /100 | #325 | Tragic 78.2% |
| Seminole | 0.0 /100 | #326 | Tragic 78.1% |
| Cajuns | 0.0 /100 | #327 | Tragic 78.1% |
| Sioux | 0.0 /100 | #328 | Tragic 78.0% |
| Creek | 0.0 /100 | #329 | Tragic 77.7% |
| Cheyenne | 0.0 /100 | #330 | Tragic 77.6% |
| Tsimshian | 0.0 /100 | #331 | Tragic 77.4% |
| Menominee | 0.0 /100 | #332 | Tragic 77.4% |