Immigrants from Eastern Africa vs Yakama Male Unemployment
COMPARE
Immigrants from Eastern Africa
Yakama
Male Unemployment
Male Unemployment Comparison
Immigrants from Eastern Africa
Yakama
5.2%
MALE UNEMPLOYMENT
79.8/ 100
METRIC RATING
137th/ 347
METRIC RANK
7.9%
MALE UNEMPLOYMENT
0.0/ 100
METRIC RATING
330th/ 347
METRIC RANK
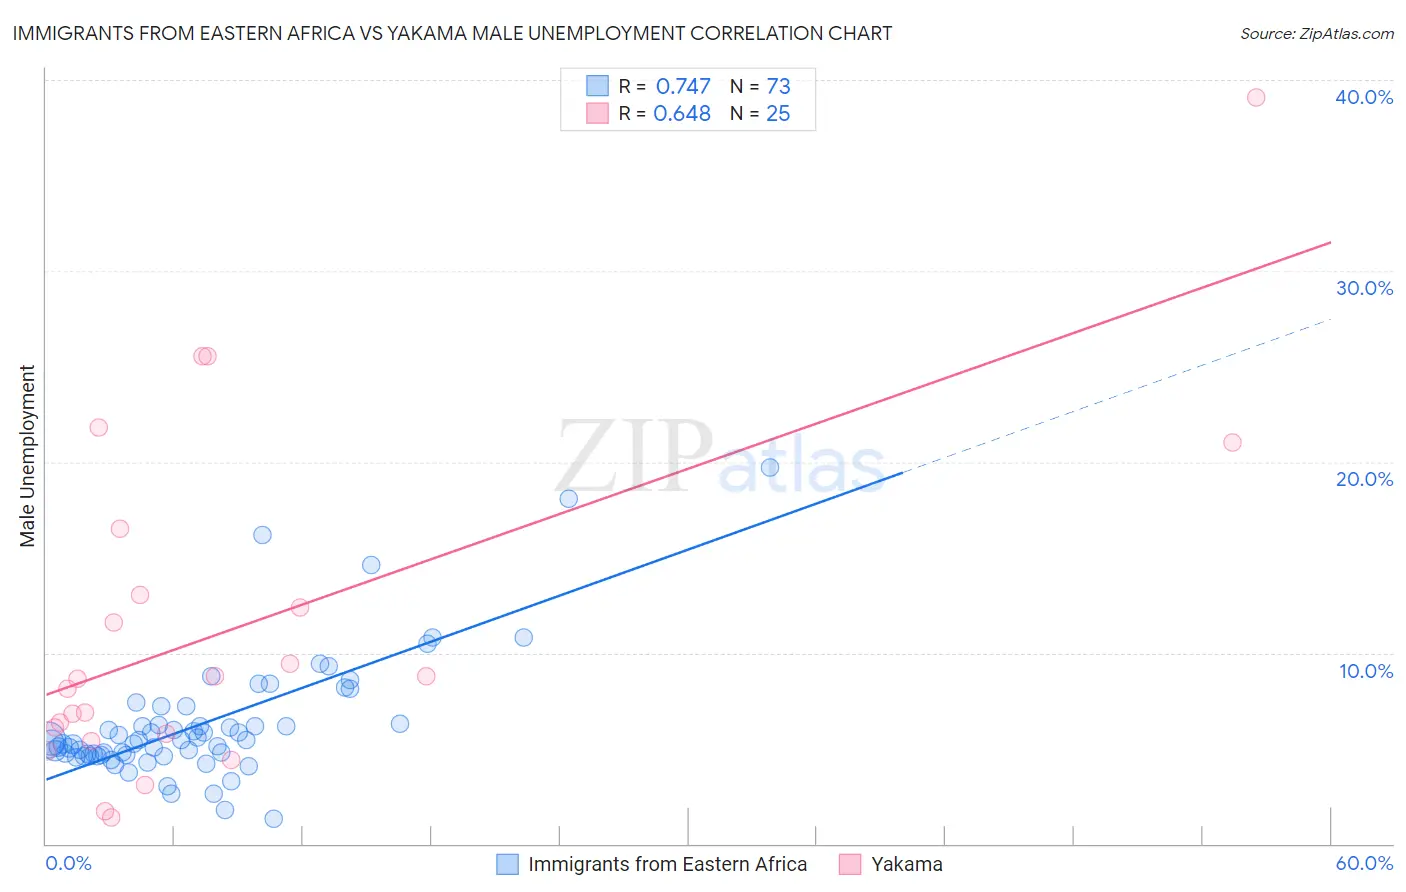
Immigrants from Eastern Africa vs Yakama Male Unemployment Correlation Chart
The statistical analysis conducted on geographies consisting of 354,168,433 people shows a strong positive correlation between the proportion of Immigrants from Eastern Africa and unemployment rate among males in the United States with a correlation coefficient (R) of 0.747 and weighted average of 5.2%. Similarly, the statistical analysis conducted on geographies consisting of 19,892,932 people shows a significant positive correlation between the proportion of Yakama and unemployment rate among males in the United States with a correlation coefficient (R) of 0.648 and weighted average of 7.9%, a difference of 52.8%.
Male Unemployment Correlation Summary
| Measurement | Immigrants from Eastern Africa | Yakama |
| Minimum | 1.3% | 1.4% |
| Maximum | 19.7% | 39.1% |
| Range | 18.4% | 37.7% |
| Mean | 6.3% | 11.3% |
| Median | 5.4% | 8.7% |
| Interquartile 25% (IQ1) | 4.6% | 5.5% |
| Interquartile 75% (IQ3) | 6.7% | 14.7% |
| Interquartile Range (IQR) | 2.1% | 9.2% |
| Standard Deviation (Sample) | 3.3% | 9.0% |
| Standard Deviation (Population) | 3.2% | 8.8% |
Similar Demographics by Male Unemployment
Demographics Similar to Immigrants from Eastern Africa by Male Unemployment
In terms of male unemployment, the demographic groups most similar to Immigrants from Eastern Africa are Lebanese (5.2%, a difference of 0.010%), Immigrants from Croatia (5.2%, a difference of 0.010%), Immigrants from Saudi Arabia (5.2%, a difference of 0.030%), Kenyan (5.2%, a difference of 0.030%), and Brazilian (5.2%, a difference of 0.040%).
| Demographics | Rating | Rank | Male Unemployment |
| Immigrants | Malaysia | 83.5 /100 | #130 | Excellent 5.2% |
| Immigrants | Germany | 83.0 /100 | #131 | Excellent 5.2% |
| Chickasaw | 82.9 /100 | #132 | Excellent 5.2% |
| Colombians | 81.1 /100 | #133 | Excellent 5.2% |
| Pakistanis | 80.5 /100 | #134 | Excellent 5.2% |
| Immigrants | Saudi Arabia | 80.1 /100 | #135 | Excellent 5.2% |
| Lebanese | 79.9 /100 | #136 | Good 5.2% |
| Immigrants | Eastern Africa | 79.8 /100 | #137 | Good 5.2% |
| Immigrants | Croatia | 79.7 /100 | #138 | Good 5.2% |
| Kenyans | 79.4 /100 | #139 | Good 5.2% |
| Brazilians | 79.3 /100 | #140 | Good 5.2% |
| Immigrants | Switzerland | 79.2 /100 | #141 | Good 5.2% |
| Fijians | 78.3 /100 | #142 | Good 5.2% |
| Syrians | 78.0 /100 | #143 | Good 5.2% |
| Sri Lankans | 77.9 /100 | #144 | Good 5.2% |
Demographics Similar to Yakama by Male Unemployment
In terms of male unemployment, the demographic groups most similar to Yakama are Immigrants from Yemen (7.8%, a difference of 1.8%), Alaska Native (8.1%, a difference of 1.9%), Native/Alaskan (7.7%, a difference of 2.7%), Paiute (7.7%, a difference of 3.1%), and Immigrants from Dominican Republic (7.6%, a difference of 4.2%).
| Demographics | Rating | Rank | Male Unemployment |
| Immigrants | Grenada | 0.0 /100 | #323 | Tragic 7.6% |
| Dominicans | 0.0 /100 | #324 | Tragic 7.6% |
| Shoshone | 0.0 /100 | #325 | Tragic 7.6% |
| Immigrants | Dominican Republic | 0.0 /100 | #326 | Tragic 7.6% |
| Paiute | 0.0 /100 | #327 | Tragic 7.7% |
| Natives/Alaskans | 0.0 /100 | #328 | Tragic 7.7% |
| Immigrants | Yemen | 0.0 /100 | #329 | Tragic 7.8% |
| Yakama | 0.0 /100 | #330 | Tragic 7.9% |
| Alaska Natives | 0.0 /100 | #331 | Tragic 8.1% |
| Pima | 0.0 /100 | #332 | Tragic 8.3% |
| Sioux | 0.0 /100 | #333 | Tragic 8.4% |
| Tsimshian | 0.0 /100 | #334 | Tragic 8.5% |
| Pueblo | 0.0 /100 | #335 | Tragic 8.5% |
| Yuman | 0.0 /100 | #336 | Tragic 8.6% |
| Puerto Ricans | 0.0 /100 | #337 | Tragic 8.6% |