Immigrants from Eastern Africa vs Yakama Single Female Poverty
COMPARE
Immigrants from Eastern Africa
Yakama
Single Female Poverty
Single Female Poverty Comparison
Immigrants from Eastern Africa
Yakama
21.6%
SINGLE FEMALE POVERTY
15.1/ 100
METRIC RATING
209th/ 347
METRIC RANK
28.3%
SINGLE FEMALE POVERTY
0.0/ 100
METRIC RATING
332nd/ 347
METRIC RANK
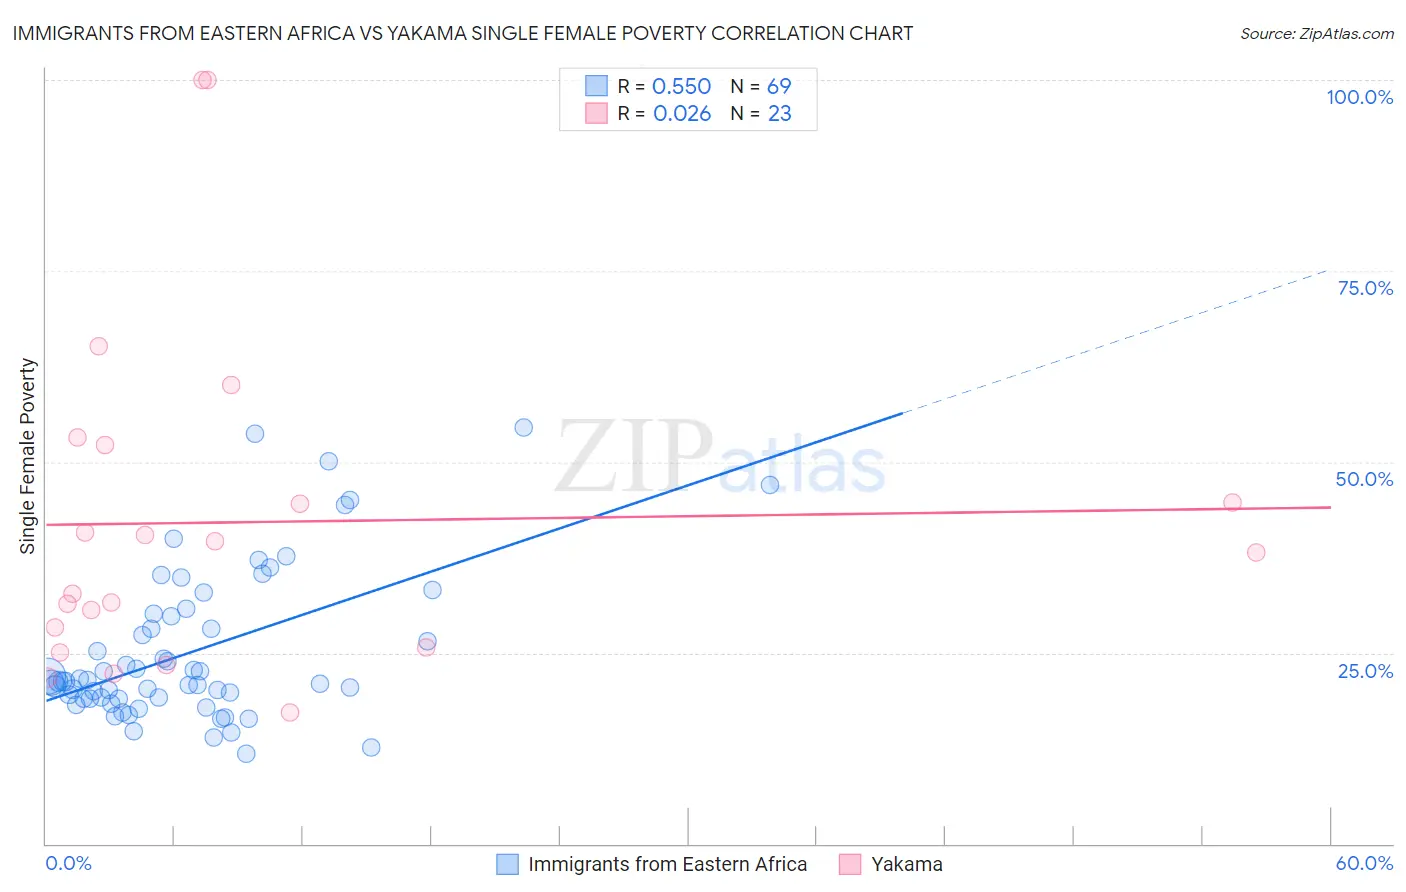
Immigrants from Eastern Africa vs Yakama Single Female Poverty Correlation Chart
The statistical analysis conducted on geographies consisting of 351,272,292 people shows a substantial positive correlation between the proportion of Immigrants from Eastern Africa and poverty level among single females in the United States with a correlation coefficient (R) of 0.550 and weighted average of 21.6%. Similarly, the statistical analysis conducted on geographies consisting of 19,831,112 people shows no correlation between the proportion of Yakama and poverty level among single females in the United States with a correlation coefficient (R) of 0.026 and weighted average of 28.3%, a difference of 31.1%.
Single Female Poverty Correlation Summary
| Measurement | Immigrants from Eastern Africa | Yakama |
| Minimum | 11.8% | 17.1% |
| Maximum | 54.5% | 100.0% |
| Range | 42.7% | 82.9% |
| Mean | 25.1% | 42.1% |
| Median | 21.3% | 38.2% |
| Interquartile 25% (IQ1) | 19.0% | 25.8% |
| Interquartile 75% (IQ3) | 29.9% | 52.2% |
| Interquartile Range (IQR) | 10.9% | 26.4% |
| Standard Deviation (Sample) | 9.9% | 22.2% |
| Standard Deviation (Population) | 9.8% | 21.7% |
Similar Demographics by Single Female Poverty
Demographics Similar to Immigrants from Eastern Africa by Single Female Poverty
In terms of single female poverty, the demographic groups most similar to Immigrants from Eastern Africa are Haitian (21.6%, a difference of 0.030%), Ghanaian (21.6%, a difference of 0.070%), Immigrants from Panama (21.6%, a difference of 0.090%), Belgian (21.5%, a difference of 0.11%), and Finnish (21.5%, a difference of 0.12%).
| Demographics | Rating | Rank | Single Female Poverty |
| Immigrants | Kenya | 20.7 /100 | #202 | Fair 21.4% |
| Immigrants | Haiti | 18.8 /100 | #203 | Poor 21.5% |
| Immigrants | Africa | 16.7 /100 | #204 | Poor 21.5% |
| Finns | 16.2 /100 | #205 | Poor 21.5% |
| Belgians | 16.1 /100 | #206 | Poor 21.5% |
| Ghanaians | 15.7 /100 | #207 | Poor 21.6% |
| Haitians | 15.4 /100 | #208 | Poor 21.6% |
| Immigrants | Eastern Africa | 15.1 /100 | #209 | Poor 21.6% |
| Immigrants | Panama | 14.4 /100 | #210 | Poor 21.6% |
| Icelanders | 14.0 /100 | #211 | Poor 21.6% |
| Jamaicans | 14.0 /100 | #212 | Poor 21.6% |
| Guamanians/Chamorros | 13.7 /100 | #213 | Poor 21.6% |
| Immigrants | Nicaragua | 13.3 /100 | #214 | Poor 21.6% |
| Ecuadorians | 12.3 /100 | #215 | Poor 21.6% |
| Immigrants | Barbados | 12.2 /100 | #216 | Poor 21.7% |
Demographics Similar to Yakama by Single Female Poverty
In terms of single female poverty, the demographic groups most similar to Yakama are Native/Alaskan (28.2%, a difference of 0.26%), Ute (28.4%, a difference of 0.42%), Hopi (28.0%, a difference of 0.90%), Pueblo (28.6%, a difference of 1.1%), and Menominee (27.8%, a difference of 1.6%).
| Demographics | Rating | Rank | Single Female Poverty |
| Choctaw | 0.0 /100 | #325 | Tragic 27.2% |
| Creek | 0.0 /100 | #326 | Tragic 27.4% |
| Dutch West Indians | 0.0 /100 | #327 | Tragic 27.5% |
| Apache | 0.0 /100 | #328 | Tragic 27.7% |
| Menominee | 0.0 /100 | #329 | Tragic 27.8% |
| Hopi | 0.0 /100 | #330 | Tragic 28.0% |
| Natives/Alaskans | 0.0 /100 | #331 | Tragic 28.2% |
| Yakama | 0.0 /100 | #332 | Tragic 28.3% |
| Ute | 0.0 /100 | #333 | Tragic 28.4% |
| Pueblo | 0.0 /100 | #334 | Tragic 28.6% |
| Immigrants | Yemen | 0.0 /100 | #335 | Tragic 28.9% |
| Colville | 0.0 /100 | #336 | Tragic 29.1% |
| Yuman | 0.0 /100 | #337 | Tragic 29.4% |
| Pima | 0.0 /100 | #338 | Tragic 30.3% |
| Cheyenne | 0.0 /100 | #339 | Tragic 30.4% |