Immigrants from Eastern Africa vs Immigrants from Cabo Verde Male Disability
COMPARE
Immigrants from Eastern Africa
Immigrants from Cabo Verde
Male Disability
Male Disability Comparison
Immigrants from Eastern Africa
Immigrants from Cabo Verde
10.8%
MALE DISABILITY
94.3/ 100
METRIC RATING
107th/ 347
METRIC RANK
12.8%
MALE DISABILITY
0.0/ 100
METRIC RATING
289th/ 347
METRIC RANK
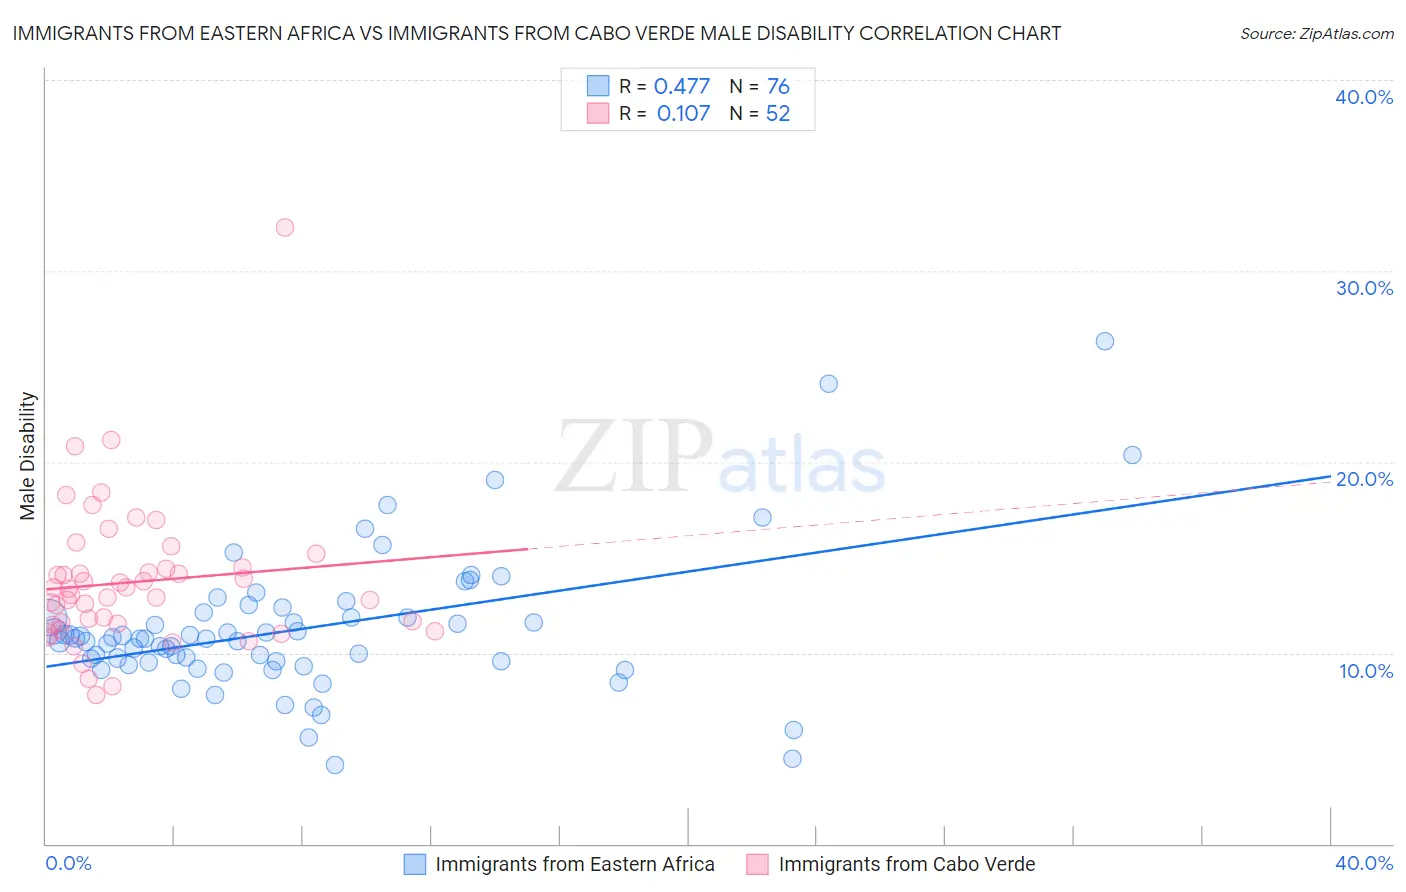
Immigrants from Eastern Africa vs Immigrants from Cabo Verde Male Disability Correlation Chart
The statistical analysis conducted on geographies consisting of 355,104,040 people shows a moderate positive correlation between the proportion of Immigrants from Eastern Africa and percentage of males with a disability in the United States with a correlation coefficient (R) of 0.477 and weighted average of 10.8%. Similarly, the statistical analysis conducted on geographies consisting of 38,149,674 people shows a poor positive correlation between the proportion of Immigrants from Cabo Verde and percentage of males with a disability in the United States with a correlation coefficient (R) of 0.107 and weighted average of 12.8%, a difference of 18.8%.
Male Disability Correlation Summary
| Measurement | Immigrants from Eastern Africa | Immigrants from Cabo Verde |
| Minimum | 4.2% | 7.8% |
| Maximum | 26.3% | 32.3% |
| Range | 22.2% | 24.5% |
| Mean | 11.3% | 13.7% |
| Median | 10.8% | 13.2% |
| Interquartile 25% (IQ1) | 9.5% | 11.5% |
| Interquartile 75% (IQ3) | 12.0% | 14.4% |
| Interquartile Range (IQR) | 2.5% | 3.0% |
| Standard Deviation (Sample) | 3.7% | 3.9% |
| Standard Deviation (Population) | 3.7% | 3.8% |
Similar Demographics by Male Disability
Demographics Similar to Immigrants from Eastern Africa by Male Disability
In terms of male disability, the demographic groups most similar to Immigrants from Eastern Africa are Immigrants from Belgium (10.8%, a difference of 0.020%), Immigrants from Uganda (10.8%, a difference of 0.070%), Immigrants (10.8%, a difference of 0.090%), Immigrants from Uruguay (10.8%, a difference of 0.13%), and Immigrants from Syria (10.8%, a difference of 0.18%).
| Demographics | Rating | Rank | Male Disability |
| Immigrants | Kazakhstan | 95.9 /100 | #100 | Exceptional 10.7% |
| Immigrants | Greece | 95.6 /100 | #101 | Exceptional 10.7% |
| Immigrants | Eastern Europe | 95.3 /100 | #102 | Exceptional 10.7% |
| Uruguayans | 95.3 /100 | #103 | Exceptional 10.7% |
| Immigrants | Nigeria | 95.1 /100 | #104 | Exceptional 10.8% |
| Immigrants | Brazil | 95.0 /100 | #105 | Exceptional 10.8% |
| Immigrants | Syria | 94.9 /100 | #106 | Exceptional 10.8% |
| Immigrants | Eastern Africa | 94.3 /100 | #107 | Exceptional 10.8% |
| Immigrants | Belgium | 94.2 /100 | #108 | Exceptional 10.8% |
| Immigrants | Uganda | 94.0 /100 | #109 | Exceptional 10.8% |
| Immigrants | Immigrants | 93.9 /100 | #110 | Exceptional 10.8% |
| Immigrants | Uruguay | 93.8 /100 | #111 | Exceptional 10.8% |
| Ghanaians | 93.4 /100 | #112 | Exceptional 10.8% |
| Immigrants | Zimbabwe | 93.0 /100 | #113 | Exceptional 10.8% |
| Central Americans | 92.7 /100 | #114 | Exceptional 10.8% |
Demographics Similar to Immigrants from Cabo Verde by Male Disability
In terms of male disability, the demographic groups most similar to Immigrants from Cabo Verde are Pima (12.8%, a difference of 0.15%), Yup'ik (12.8%, a difference of 0.19%), White/Caucasian (12.8%, a difference of 0.24%), English (12.8%, a difference of 0.30%), and Cape Verdean (12.8%, a difference of 0.38%).
| Demographics | Rating | Rank | Male Disability |
| Irish | 0.0 /100 | #282 | Tragic 12.7% |
| Germans | 0.0 /100 | #283 | Tragic 12.7% |
| Spanish | 0.0 /100 | #284 | Tragic 12.7% |
| Welsh | 0.0 /100 | #285 | Tragic 12.7% |
| Scottish | 0.0 /100 | #286 | Tragic 12.8% |
| Cape Verdeans | 0.0 /100 | #287 | Tragic 12.8% |
| Yup'ik | 0.0 /100 | #288 | Tragic 12.8% |
| Immigrants | Cabo Verde | 0.0 /100 | #289 | Tragic 12.8% |
| Pima | 0.0 /100 | #290 | Tragic 12.8% |
| Whites/Caucasians | 0.0 /100 | #291 | Tragic 12.8% |
| English | 0.0 /100 | #292 | Tragic 12.8% |
| Yaqui | 0.0 /100 | #293 | Tragic 12.9% |
| Marshallese | 0.0 /100 | #294 | Tragic 12.9% |
| Immigrants | Micronesia | 0.0 /100 | #295 | Tragic 12.9% |
| Immigrants | Nonimmigrants | 0.0 /100 | #296 | Tragic 12.9% |