Immigrants from Dominica vs Vietnamese Disability Age 5 to 17
COMPARE
Immigrants from Dominica
Vietnamese
Disability Age 5 to 17
Disability Age 5 to 17 Comparison
Immigrants from Dominica
Vietnamese
6.3%
DISABILITY AGE 5 TO 17
0.0/ 100
METRIC RATING
311th/ 347
METRIC RANK
5.1%
DISABILITY AGE 5 TO 17
100.0/ 100
METRIC RATING
47th/ 347
METRIC RANK
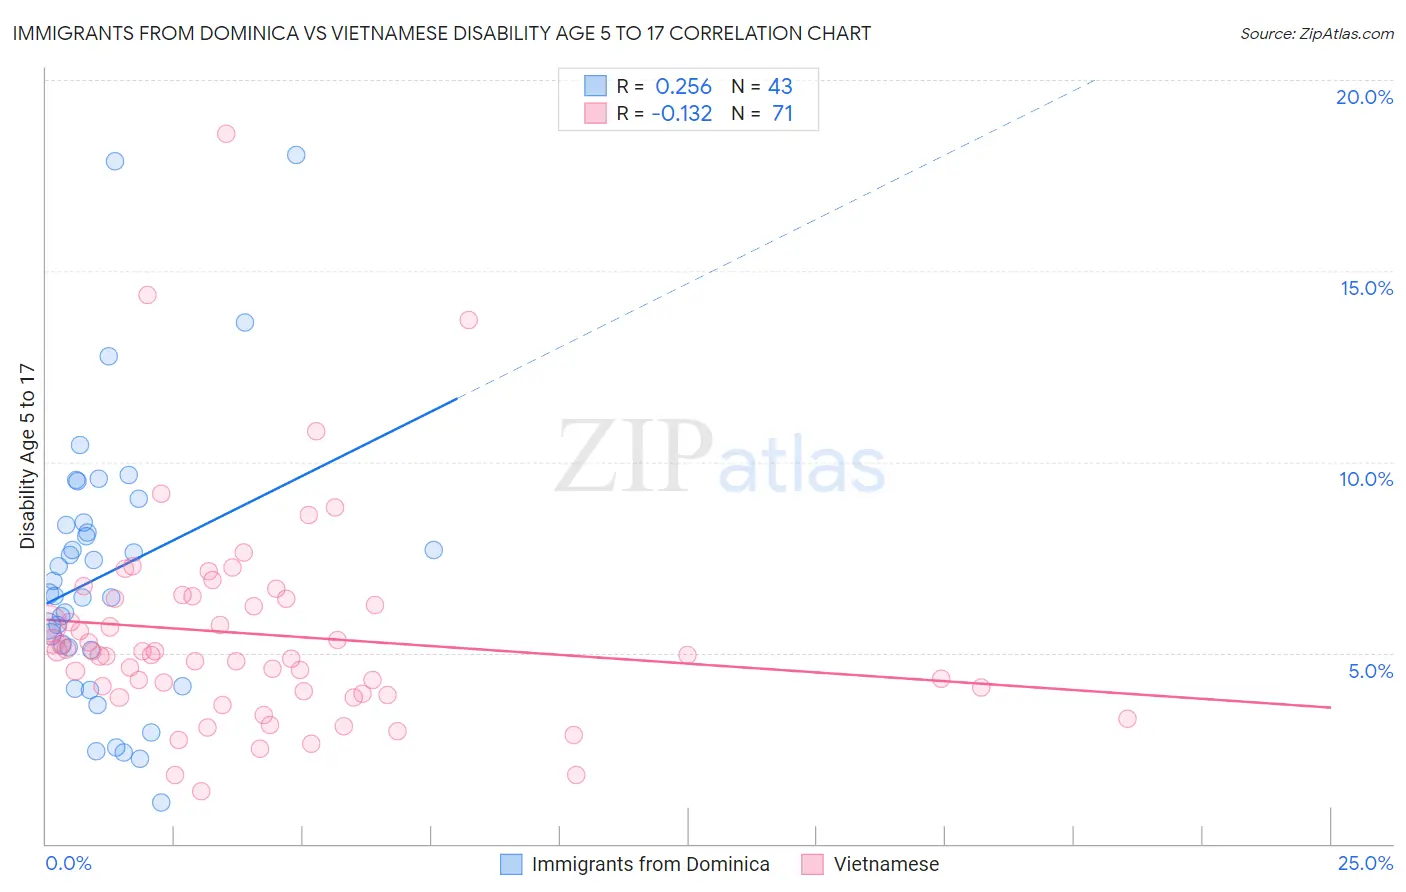
Immigrants from Dominica vs Vietnamese Disability Age 5 to 17 Correlation Chart
The statistical analysis conducted on geographies consisting of 83,671,068 people shows a weak positive correlation between the proportion of Immigrants from Dominica and percentage of population with a disability between the ages 5 and 17 in the United States with a correlation coefficient (R) of 0.256 and weighted average of 6.3%. Similarly, the statistical analysis conducted on geographies consisting of 170,164,131 people shows a poor negative correlation between the proportion of Vietnamese and percentage of population with a disability between the ages 5 and 17 in the United States with a correlation coefficient (R) of -0.132 and weighted average of 5.1%, a difference of 25.7%.
Disability Age 5 to 17 Correlation Summary
| Measurement | Immigrants from Dominica | Vietnamese |
| Minimum | 1.1% | 1.4% |
| Maximum | 18.0% | 18.6% |
| Range | 17.0% | 17.2% |
| Mean | 7.1% | 5.5% |
| Median | 6.5% | 5.0% |
| Interquartile 25% (IQ1) | 5.1% | 3.9% |
| Interquartile 75% (IQ3) | 8.4% | 6.4% |
| Interquartile Range (IQR) | 3.3% | 2.5% |
| Standard Deviation (Sample) | 3.7% | 2.8% |
| Standard Deviation (Population) | 3.6% | 2.8% |
Similar Demographics by Disability Age 5 to 17
Demographics Similar to Immigrants from Dominica by Disability Age 5 to 17
In terms of disability age 5 to 17, the demographic groups most similar to Immigrants from Dominica are Alaskan Athabascan (6.3%, a difference of 0.040%), Bermudan (6.4%, a difference of 0.12%), Hmong (6.3%, a difference of 0.18%), Scotch-Irish (6.3%, a difference of 0.20%), and Bahamian (6.3%, a difference of 0.43%).
| Demographics | Rating | Rank | Disability Age 5 to 17 |
| Senegalese | 0.0 /100 | #304 | Tragic 6.3% |
| Natives/Alaskans | 0.0 /100 | #305 | Tragic 6.3% |
| Immigrants | Nonimmigrants | 0.0 /100 | #306 | Tragic 6.3% |
| Bahamians | 0.0 /100 | #307 | Tragic 6.3% |
| Scotch-Irish | 0.0 /100 | #308 | Tragic 6.3% |
| Hmong | 0.0 /100 | #309 | Tragic 6.3% |
| Alaskan Athabascans | 0.0 /100 | #310 | Tragic 6.3% |
| Immigrants | Dominica | 0.0 /100 | #311 | Tragic 6.3% |
| Bermudans | 0.0 /100 | #312 | Tragic 6.4% |
| Apache | 0.0 /100 | #313 | Tragic 6.4% |
| French | 0.0 /100 | #314 | Tragic 6.4% |
| Immigrants | Portugal | 0.0 /100 | #315 | Tragic 6.4% |
| Immigrants | Dominican Republic | 0.0 /100 | #316 | Tragic 6.4% |
| Kiowa | 0.0 /100 | #317 | Tragic 6.4% |
| Comanche | 0.0 /100 | #318 | Tragic 6.4% |
Demographics Similar to Vietnamese by Disability Age 5 to 17
In terms of disability age 5 to 17, the demographic groups most similar to Vietnamese are Assyrian/Chaldean/Syriac (5.0%, a difference of 0.13%), Korean (5.1%, a difference of 0.18%), Tongan (5.0%, a difference of 0.19%), Egyptian (5.0%, a difference of 0.27%), and Immigrants from Western Asia (5.1%, a difference of 0.27%).
| Demographics | Rating | Rank | Disability Age 5 to 17 |
| Okinawans | 100.0 /100 | #40 | Exceptional 5.0% |
| Immigrants | Australia | 100.0 /100 | #41 | Exceptional 5.0% |
| Immigrants | Sri Lanka | 100.0 /100 | #42 | Exceptional 5.0% |
| Immigrants | Russia | 100.0 /100 | #43 | Exceptional 5.0% |
| Egyptians | 100.0 /100 | #44 | Exceptional 5.0% |
| Tongans | 100.0 /100 | #45 | Exceptional 5.0% |
| Assyrians/Chaldeans/Syriacs | 100.0 /100 | #46 | Exceptional 5.0% |
| Vietnamese | 100.0 /100 | #47 | Exceptional 5.1% |
| Koreans | 100.0 /100 | #48 | Exceptional 5.1% |
| Immigrants | Western Asia | 100.0 /100 | #49 | Exceptional 5.1% |
| Argentineans | 99.9 /100 | #50 | Exceptional 5.1% |
| Turks | 99.9 /100 | #51 | Exceptional 5.1% |
| Immigrants | Fiji | 99.9 /100 | #52 | Exceptional 5.1% |
| Immigrants | Lithuania | 99.9 /100 | #53 | Exceptional 5.1% |
| Paraguayans | 99.9 /100 | #54 | Exceptional 5.1% |