Indonesian vs Vietnamese Disability Age 5 to 17
COMPARE
Indonesian
Vietnamese
Disability Age 5 to 17
Disability Age 5 to 17 Comparison
Indonesians
Vietnamese
5.9%
DISABILITY AGE 5 TO 17
2.0/ 100
METRIC RATING
243rd/ 347
METRIC RANK
5.1%
DISABILITY AGE 5 TO 17
100.0/ 100
METRIC RATING
47th/ 347
METRIC RANK
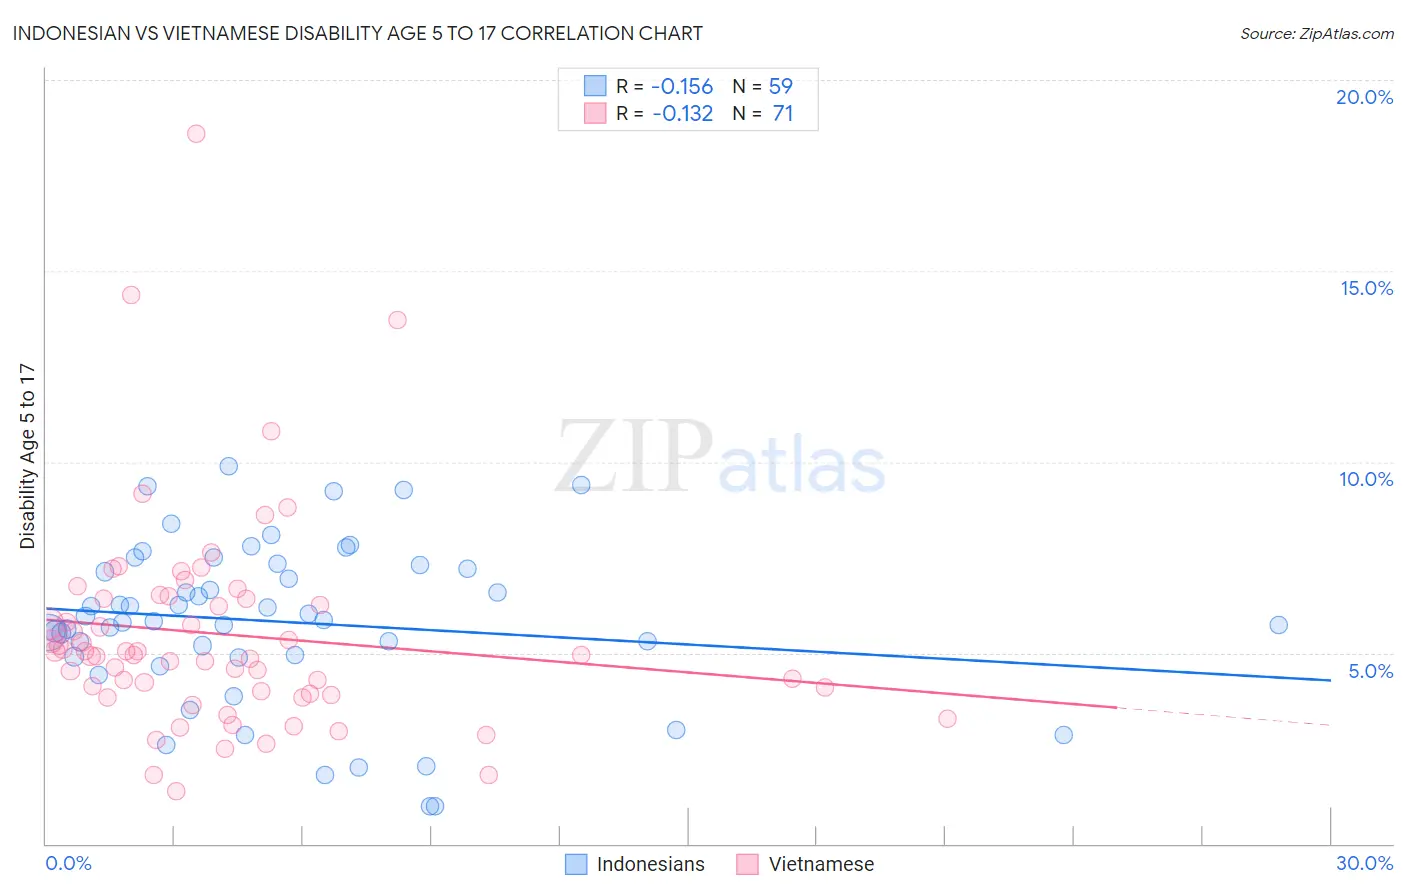
Indonesian vs Vietnamese Disability Age 5 to 17 Correlation Chart
The statistical analysis conducted on geographies consisting of 162,352,811 people shows a poor negative correlation between the proportion of Indonesians and percentage of population with a disability between the ages 5 and 17 in the United States with a correlation coefficient (R) of -0.156 and weighted average of 5.9%. Similarly, the statistical analysis conducted on geographies consisting of 170,164,131 people shows a poor negative correlation between the proportion of Vietnamese and percentage of population with a disability between the ages 5 and 17 in the United States with a correlation coefficient (R) of -0.132 and weighted average of 5.1%, a difference of 16.2%.
Disability Age 5 to 17 Correlation Summary
| Measurement | Indonesian | Vietnamese |
| Minimum | 0.98% | 1.4% |
| Maximum | 9.9% | 18.6% |
| Range | 8.9% | 17.2% |
| Mean | 5.8% | 5.5% |
| Median | 5.8% | 5.0% |
| Interquartile 25% (IQ1) | 4.9% | 3.9% |
| Interquartile 75% (IQ3) | 7.3% | 6.4% |
| Interquartile Range (IQR) | 2.4% | 2.5% |
| Standard Deviation (Sample) | 2.1% | 2.8% |
| Standard Deviation (Population) | 2.1% | 2.8% |
Similar Demographics by Disability Age 5 to 17
Demographics Similar to Indonesians by Disability Age 5 to 17
In terms of disability age 5 to 17, the demographic groups most similar to Indonesians are Spaniard (5.9%, a difference of 0.010%), Immigrants from Germany (5.9%, a difference of 0.060%), Immigrants from Micronesia (5.9%, a difference of 0.060%), Tlingit-Haida (5.9%, a difference of 0.060%), and Immigrants from Caribbean (5.9%, a difference of 0.090%).
| Demographics | Rating | Rank | Disability Age 5 to 17 |
| Immigrants | Brazil | 3.2 /100 | #236 | Tragic 5.8% |
| Sudanese | 2.9 /100 | #237 | Tragic 5.8% |
| Hungarians | 2.6 /100 | #238 | Tragic 5.8% |
| German Russians | 2.4 /100 | #239 | Tragic 5.9% |
| West Indians | 2.4 /100 | #240 | Tragic 5.9% |
| Immigrants | Caribbean | 2.1 /100 | #241 | Tragic 5.9% |
| Spaniards | 2.0 /100 | #242 | Tragic 5.9% |
| Indonesians | 2.0 /100 | #243 | Tragic 5.9% |
| Immigrants | Germany | 1.9 /100 | #244 | Tragic 5.9% |
| Immigrants | Micronesia | 1.9 /100 | #245 | Tragic 5.9% |
| Tlingit-Haida | 1.9 /100 | #246 | Tragic 5.9% |
| Immigrants | Honduras | 1.8 /100 | #247 | Tragic 5.9% |
| British | 1.7 /100 | #248 | Tragic 5.9% |
| Immigrants | Ghana | 1.7 /100 | #249 | Tragic 5.9% |
| Poles | 1.5 /100 | #250 | Tragic 5.9% |
Demographics Similar to Vietnamese by Disability Age 5 to 17
In terms of disability age 5 to 17, the demographic groups most similar to Vietnamese are Assyrian/Chaldean/Syriac (5.0%, a difference of 0.13%), Korean (5.1%, a difference of 0.18%), Tongan (5.0%, a difference of 0.19%), Egyptian (5.0%, a difference of 0.27%), and Immigrants from Western Asia (5.1%, a difference of 0.27%).
| Demographics | Rating | Rank | Disability Age 5 to 17 |
| Okinawans | 100.0 /100 | #40 | Exceptional 5.0% |
| Immigrants | Australia | 100.0 /100 | #41 | Exceptional 5.0% |
| Immigrants | Sri Lanka | 100.0 /100 | #42 | Exceptional 5.0% |
| Immigrants | Russia | 100.0 /100 | #43 | Exceptional 5.0% |
| Egyptians | 100.0 /100 | #44 | Exceptional 5.0% |
| Tongans | 100.0 /100 | #45 | Exceptional 5.0% |
| Assyrians/Chaldeans/Syriacs | 100.0 /100 | #46 | Exceptional 5.0% |
| Vietnamese | 100.0 /100 | #47 | Exceptional 5.1% |
| Koreans | 100.0 /100 | #48 | Exceptional 5.1% |
| Immigrants | Western Asia | 100.0 /100 | #49 | Exceptional 5.1% |
| Argentineans | 99.9 /100 | #50 | Exceptional 5.1% |
| Turks | 99.9 /100 | #51 | Exceptional 5.1% |
| Immigrants | Fiji | 99.9 /100 | #52 | Exceptional 5.1% |
| Immigrants | Lithuania | 99.9 /100 | #53 | Exceptional 5.1% |
| Paraguayans | 99.9 /100 | #54 | Exceptional 5.1% |