Latvian vs Vietnamese Disability Age 5 to 17
COMPARE
Latvian
Vietnamese
Disability Age 5 to 17
Disability Age 5 to 17 Comparison
Latvians
Vietnamese
5.4%
DISABILITY AGE 5 TO 17
95.0/ 100
METRIC RATING
127th/ 347
METRIC RANK
5.1%
DISABILITY AGE 5 TO 17
100.0/ 100
METRIC RATING
47th/ 347
METRIC RANK
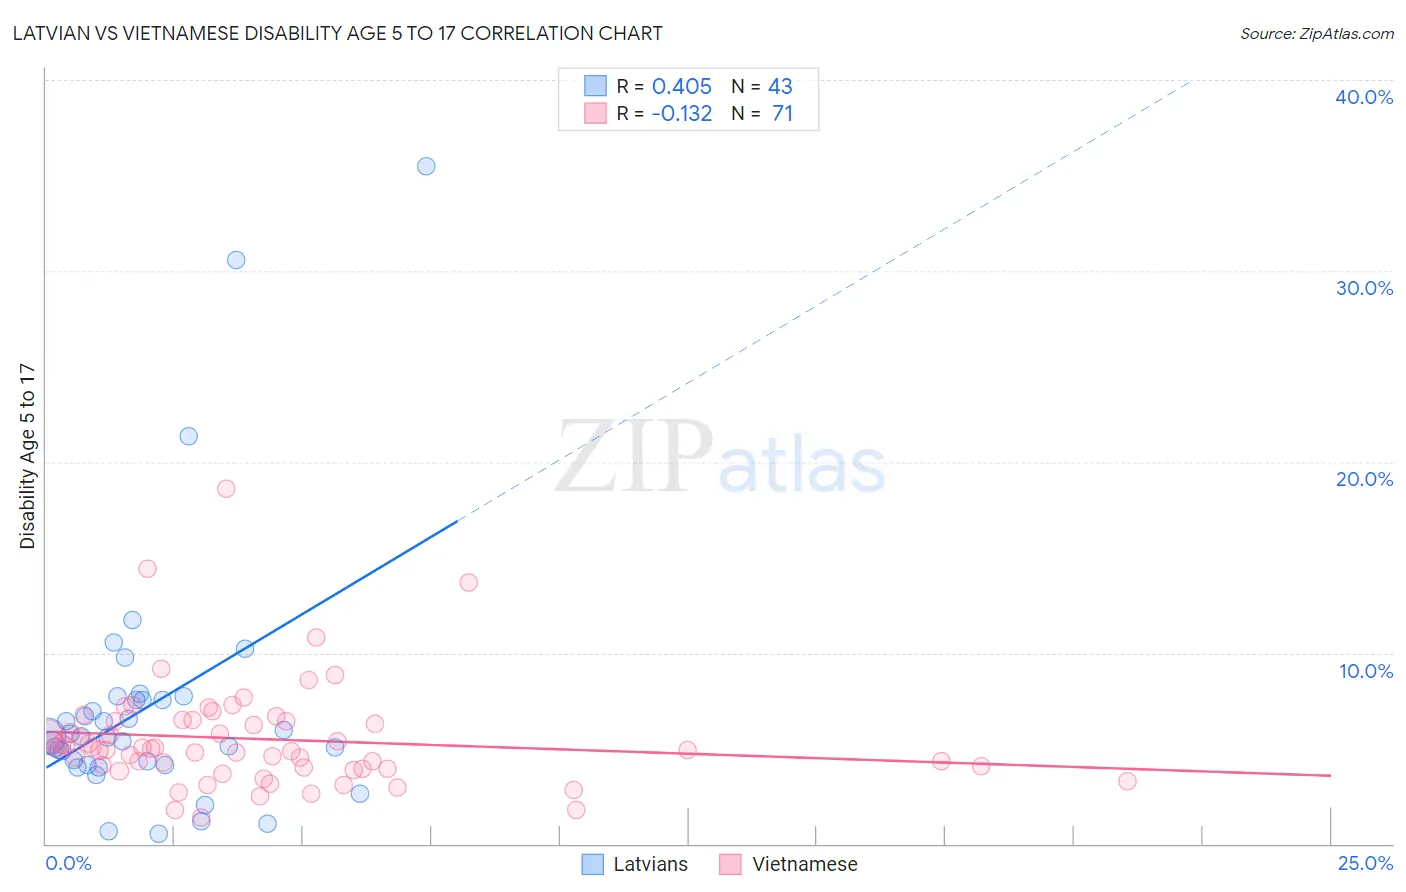
Latvian vs Vietnamese Disability Age 5 to 17 Correlation Chart
The statistical analysis conducted on geographies consisting of 219,260,682 people shows a moderate positive correlation between the proportion of Latvians and percentage of population with a disability between the ages 5 and 17 in the United States with a correlation coefficient (R) of 0.405 and weighted average of 5.4%. Similarly, the statistical analysis conducted on geographies consisting of 170,164,131 people shows a poor negative correlation between the proportion of Vietnamese and percentage of population with a disability between the ages 5 and 17 in the United States with a correlation coefficient (R) of -0.132 and weighted average of 5.1%, a difference of 6.8%.
Disability Age 5 to 17 Correlation Summary
| Measurement | Latvian | Vietnamese |
| Minimum | 0.51% | 1.4% |
| Maximum | 35.5% | 18.6% |
| Range | 35.0% | 17.2% |
| Mean | 7.2% | 5.5% |
| Median | 5.6% | 5.0% |
| Interquartile 25% (IQ1) | 4.1% | 3.9% |
| Interquartile 75% (IQ3) | 7.5% | 6.4% |
| Interquartile Range (IQR) | 3.4% | 2.5% |
| Standard Deviation (Sample) | 6.8% | 2.8% |
| Standard Deviation (Population) | 6.7% | 2.8% |
Similar Demographics by Disability Age 5 to 17
Demographics Similar to Latvians by Disability Age 5 to 17
In terms of disability age 5 to 17, the demographic groups most similar to Latvians are New Zealander (5.4%, a difference of 0.0%), Immigrants from Chile (5.4%, a difference of 0.010%), Crow (5.4%, a difference of 0.030%), Immigrants from Venezuela (5.4%, a difference of 0.11%), and Immigrants from Ethiopia (5.4%, a difference of 0.16%).
| Demographics | Rating | Rank | Disability Age 5 to 17 |
| Immigrants | Immigrants | 97.0 /100 | #120 | Exceptional 5.4% |
| Maltese | 96.0 /100 | #121 | Exceptional 5.4% |
| Chileans | 95.8 /100 | #122 | Exceptional 5.4% |
| Immigrants | Ethiopia | 95.5 /100 | #123 | Exceptional 5.4% |
| Crow | 95.0 /100 | #124 | Exceptional 5.4% |
| Immigrants | Chile | 95.0 /100 | #125 | Exceptional 5.4% |
| New Zealanders | 95.0 /100 | #126 | Exceptional 5.4% |
| Latvians | 95.0 /100 | #127 | Exceptional 5.4% |
| Immigrants | Venezuela | 94.5 /100 | #128 | Exceptional 5.4% |
| Romanians | 94.1 /100 | #129 | Exceptional 5.4% |
| Immigrants | Bulgaria | 94.0 /100 | #130 | Exceptional 5.4% |
| Arabs | 92.9 /100 | #131 | Exceptional 5.4% |
| Immigrants | Colombia | 92.9 /100 | #132 | Exceptional 5.4% |
| Venezuelans | 92.7 /100 | #133 | Exceptional 5.4% |
| Yuman | 92.3 /100 | #134 | Exceptional 5.4% |
Demographics Similar to Vietnamese by Disability Age 5 to 17
In terms of disability age 5 to 17, the demographic groups most similar to Vietnamese are Assyrian/Chaldean/Syriac (5.0%, a difference of 0.13%), Korean (5.1%, a difference of 0.18%), Tongan (5.0%, a difference of 0.19%), Egyptian (5.0%, a difference of 0.27%), and Immigrants from Western Asia (5.1%, a difference of 0.27%).
| Demographics | Rating | Rank | Disability Age 5 to 17 |
| Okinawans | 100.0 /100 | #40 | Exceptional 5.0% |
| Immigrants | Australia | 100.0 /100 | #41 | Exceptional 5.0% |
| Immigrants | Sri Lanka | 100.0 /100 | #42 | Exceptional 5.0% |
| Immigrants | Russia | 100.0 /100 | #43 | Exceptional 5.0% |
| Egyptians | 100.0 /100 | #44 | Exceptional 5.0% |
| Tongans | 100.0 /100 | #45 | Exceptional 5.0% |
| Assyrians/Chaldeans/Syriacs | 100.0 /100 | #46 | Exceptional 5.0% |
| Vietnamese | 100.0 /100 | #47 | Exceptional 5.1% |
| Koreans | 100.0 /100 | #48 | Exceptional 5.1% |
| Immigrants | Western Asia | 100.0 /100 | #49 | Exceptional 5.1% |
| Argentineans | 99.9 /100 | #50 | Exceptional 5.1% |
| Turks | 99.9 /100 | #51 | Exceptional 5.1% |
| Immigrants | Fiji | 99.9 /100 | #52 | Exceptional 5.1% |
| Immigrants | Lithuania | 99.9 /100 | #53 | Exceptional 5.1% |
| Paraguayans | 99.9 /100 | #54 | Exceptional 5.1% |