Immigrants from Czechoslovakia vs Hungarian Male Poverty
COMPARE
Immigrants from Czechoslovakia
Hungarian
Male Poverty
Male Poverty Comparison
Immigrants from Czechoslovakia
Hungarians
10.0%
MALE POVERTY
98.6/ 100
METRIC RATING
53rd/ 347
METRIC RANK
11.1%
MALE POVERTY
55.1/ 100
METRIC RATING
167th/ 347
METRIC RANK
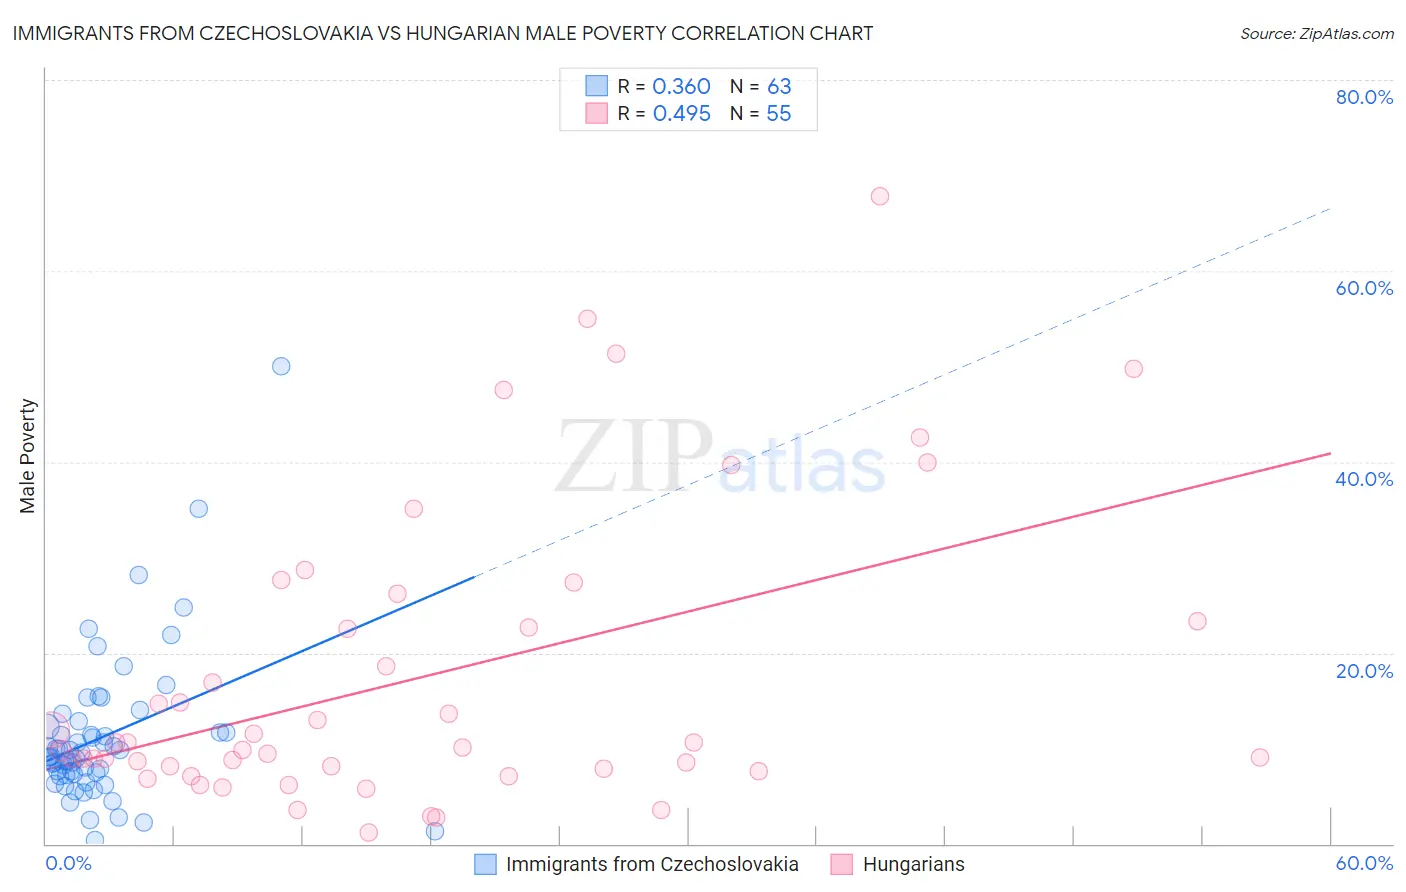
Immigrants from Czechoslovakia vs Hungarian Male Poverty Correlation Chart
The statistical analysis conducted on geographies consisting of 195,424,226 people shows a mild positive correlation between the proportion of Immigrants from Czechoslovakia and poverty level among males in the United States with a correlation coefficient (R) of 0.360 and weighted average of 10.0%. Similarly, the statistical analysis conducted on geographies consisting of 485,483,073 people shows a moderate positive correlation between the proportion of Hungarians and poverty level among males in the United States with a correlation coefficient (R) of 0.495 and weighted average of 11.1%, a difference of 11.1%.
Male Poverty Correlation Summary
| Measurement | Immigrants from Czechoslovakia | Hungarian |
| Minimum | 0.44% | 1.2% |
| Maximum | 50.0% | 67.8% |
| Range | 49.6% | 66.6% |
| Mean | 11.2% | 17.3% |
| Median | 9.2% | 10.1% |
| Interquartile 25% (IQ1) | 7.2% | 7.8% |
| Interquartile 75% (IQ3) | 12.2% | 23.3% |
| Interquartile Range (IQR) | 5.0% | 15.4% |
| Standard Deviation (Sample) | 8.0% | 15.4% |
| Standard Deviation (Population) | 7.9% | 15.3% |
Similar Demographics by Male Poverty
Demographics Similar to Immigrants from Czechoslovakia by Male Poverty
In terms of male poverty, the demographic groups most similar to Immigrants from Czechoslovakia are Asian (10.0%, a difference of 0.070%), Immigrants from Croatia (10.0%, a difference of 0.16%), Immigrants from Philippines (10.0%, a difference of 0.27%), Immigrants from Austria (10.0%, a difference of 0.28%), and Slovene (10.0%, a difference of 0.32%).
| Demographics | Rating | Rank | Male Poverty |
| Turks | 98.9 /100 | #46 | Exceptional 10.0% |
| Immigrants | Singapore | 98.8 /100 | #47 | Exceptional 10.0% |
| Immigrants | Japan | 98.8 /100 | #48 | Exceptional 10.0% |
| Slovenes | 98.8 /100 | #49 | Exceptional 10.0% |
| Immigrants | Philippines | 98.7 /100 | #50 | Exceptional 10.0% |
| Immigrants | Croatia | 98.7 /100 | #51 | Exceptional 10.0% |
| Asians | 98.7 /100 | #52 | Exceptional 10.0% |
| Immigrants | Czechoslovakia | 98.6 /100 | #53 | Exceptional 10.0% |
| Immigrants | Austria | 98.5 /100 | #54 | Exceptional 10.0% |
| Germans | 98.3 /100 | #55 | Exceptional 10.1% |
| Immigrants | Bulgaria | 98.2 /100 | #56 | Exceptional 10.1% |
| Estonians | 98.1 /100 | #57 | Exceptional 10.1% |
| Scandinavians | 98.0 /100 | #58 | Exceptional 10.1% |
| Immigrants | Europe | 97.9 /100 | #59 | Exceptional 10.1% |
| Ukrainians | 97.9 /100 | #60 | Exceptional 10.1% |
Demographics Similar to Hungarians by Male Poverty
In terms of male poverty, the demographic groups most similar to Hungarians are Immigrants from Albania (11.1%, a difference of 0.020%), Immigrants from Portugal (11.1%, a difference of 0.020%), Immigrants from Spain (11.1%, a difference of 0.040%), Immigrants from Colombia (11.1%, a difference of 0.090%), and South American (11.1%, a difference of 0.14%).
| Demographics | Rating | Rank | Male Poverty |
| Soviet Union | 60.3 /100 | #160 | Good 11.1% |
| Immigrants | Northern Africa | 59.7 /100 | #161 | Average 11.1% |
| Immigrants | Chile | 57.4 /100 | #162 | Average 11.1% |
| Whites/Caucasians | 56.7 /100 | #163 | Average 11.1% |
| Ethiopians | 56.7 /100 | #164 | Average 11.1% |
| Immigrants | Spain | 55.5 /100 | #165 | Average 11.1% |
| Immigrants | Albania | 55.3 /100 | #166 | Average 11.1% |
| Hungarians | 55.1 /100 | #167 | Average 11.1% |
| Immigrants | Portugal | 54.9 /100 | #168 | Average 11.1% |
| Immigrants | Colombia | 54.2 /100 | #169 | Average 11.1% |
| South Americans | 53.8 /100 | #170 | Average 11.1% |
| Uruguayans | 51.0 /100 | #171 | Average 11.2% |
| Immigrants | Ethiopia | 50.7 /100 | #172 | Average 11.2% |
| Pennsylvania Germans | 50.5 /100 | #173 | Average 11.2% |
| Immigrants | Oceania | 50.0 /100 | #174 | Average 11.2% |