Immigrants from Cuba vs Kenyan Ambulatory Disability
COMPARE
Immigrants from Cuba
Kenyan
Ambulatory Disability
Ambulatory Disability Comparison
Immigrants from Cuba
Kenyans
6.5%
AMBULATORY DISABILITY
1.4/ 100
METRIC RATING
247th/ 347
METRIC RANK
5.8%
AMBULATORY DISABILITY
98.4/ 100
METRIC RATING
94th/ 347
METRIC RANK
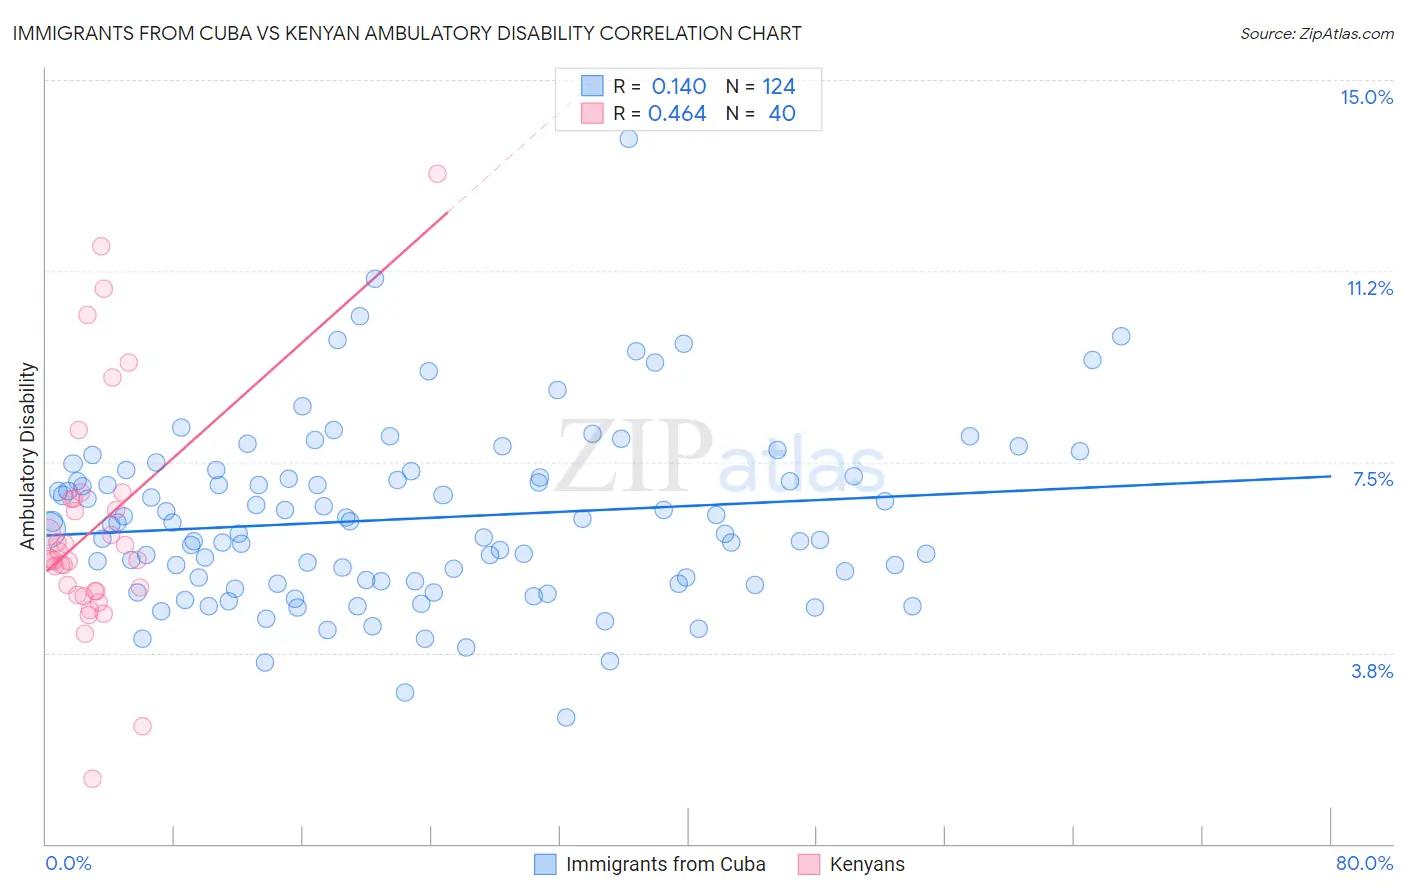
Immigrants from Cuba vs Kenyan Ambulatory Disability Correlation Chart
The statistical analysis conducted on geographies consisting of 325,985,542 people shows a poor positive correlation between the proportion of Immigrants from Cuba and percentage of population with ambulatory disability in the United States with a correlation coefficient (R) of 0.140 and weighted average of 6.5%. Similarly, the statistical analysis conducted on geographies consisting of 168,175,436 people shows a moderate positive correlation between the proportion of Kenyans and percentage of population with ambulatory disability in the United States with a correlation coefficient (R) of 0.464 and weighted average of 5.8%, a difference of 11.8%.
Ambulatory Disability Correlation Summary
| Measurement | Immigrants from Cuba | Kenyan |
| Minimum | 2.5% | 1.3% |
| Maximum | 13.8% | 13.2% |
| Range | 11.4% | 11.9% |
| Mean | 6.4% | 6.2% |
| Median | 6.3% | 5.6% |
| Interquartile 25% (IQ1) | 5.2% | 5.0% |
| Interquartile 75% (IQ3) | 7.2% | 6.8% |
| Interquartile Range (IQR) | 2.1% | 1.8% |
| Standard Deviation (Sample) | 1.7% | 2.3% |
| Standard Deviation (Population) | 1.7% | 2.3% |
Similar Demographics by Ambulatory Disability
Demographics Similar to Immigrants from Cuba by Ambulatory Disability
In terms of ambulatory disability, the demographic groups most similar to Immigrants from Cuba are Immigrants from Portugal (6.5%, a difference of 0.020%), Armenian (6.5%, a difference of 0.050%), Tlingit-Haida (6.5%, a difference of 0.070%), German (6.5%, a difference of 0.10%), and Immigrants from Panama (6.5%, a difference of 0.10%).
| Demographics | Rating | Rank | Ambulatory Disability |
| Immigrants | Senegal | 1.7 /100 | #240 | Tragic 6.4% |
| Immigrants | Haiti | 1.6 /100 | #241 | Tragic 6.5% |
| Spaniards | 1.6 /100 | #242 | Tragic 6.5% |
| Germans | 1.5 /100 | #243 | Tragic 6.5% |
| Immigrants | Panama | 1.5 /100 | #244 | Tragic 6.5% |
| Tlingit-Haida | 1.5 /100 | #245 | Tragic 6.5% |
| Armenians | 1.5 /100 | #246 | Tragic 6.5% |
| Immigrants | Cuba | 1.4 /100 | #247 | Tragic 6.5% |
| Immigrants | Portugal | 1.4 /100 | #248 | Tragic 6.5% |
| Native Hawaiians | 1.1 /100 | #249 | Tragic 6.5% |
| Chinese | 1.0 /100 | #250 | Tragic 6.5% |
| Hawaiians | 0.9 /100 | #251 | Tragic 6.5% |
| Immigrants | Bahamas | 0.8 /100 | #252 | Tragic 6.5% |
| Scottish | 0.7 /100 | #253 | Tragic 6.5% |
| Belizeans | 0.7 /100 | #254 | Tragic 6.5% |
Demographics Similar to Kenyans by Ambulatory Disability
In terms of ambulatory disability, the demographic groups most similar to Kenyans are Immigrants from El Salvador (5.8%, a difference of 0.040%), Salvadoran (5.8%, a difference of 0.060%), Immigrants from Somalia (5.8%, a difference of 0.10%), Immigrants from Lebanon (5.8%, a difference of 0.12%), and Immigrants from Denmark (5.8%, a difference of 0.19%).
| Demographics | Rating | Rank | Ambulatory Disability |
| Immigrants | Chile | 98.9 /100 | #87 | Exceptional 5.8% |
| Soviet Union | 98.9 /100 | #88 | Exceptional 5.8% |
| Bhutanese | 98.8 /100 | #89 | Exceptional 5.8% |
| Australians | 98.8 /100 | #90 | Exceptional 5.8% |
| Immigrants | Sudan | 98.8 /100 | #91 | Exceptional 5.8% |
| Immigrants | Sierra Leone | 98.6 /100 | #92 | Exceptional 5.8% |
| Immigrants | Denmark | 98.6 /100 | #93 | Exceptional 5.8% |
| Kenyans | 98.4 /100 | #94 | Exceptional 5.8% |
| Immigrants | El Salvador | 98.4 /100 | #95 | Exceptional 5.8% |
| Salvadorans | 98.4 /100 | #96 | Exceptional 5.8% |
| Immigrants | Somalia | 98.3 /100 | #97 | Exceptional 5.8% |
| Immigrants | Lebanon | 98.3 /100 | #98 | Exceptional 5.8% |
| Immigrants | Northern Europe | 98.2 /100 | #99 | Exceptional 5.8% |
| Immigrants | Serbia | 97.9 /100 | #100 | Exceptional 5.8% |
| Immigrants | South America | 97.9 /100 | #101 | Exceptional 5.8% |