Burmese vs Arapaho Male Disability
COMPARE
Burmese
Arapaho
Male Disability
Male Disability Comparison
Burmese
Arapaho
10.0%
MALE DISABILITY
100.0/ 100
METRIC RATING
21st/ 347
METRIC RANK
13.3%
MALE DISABILITY
0.0/ 100
METRIC RATING
307th/ 347
METRIC RANK
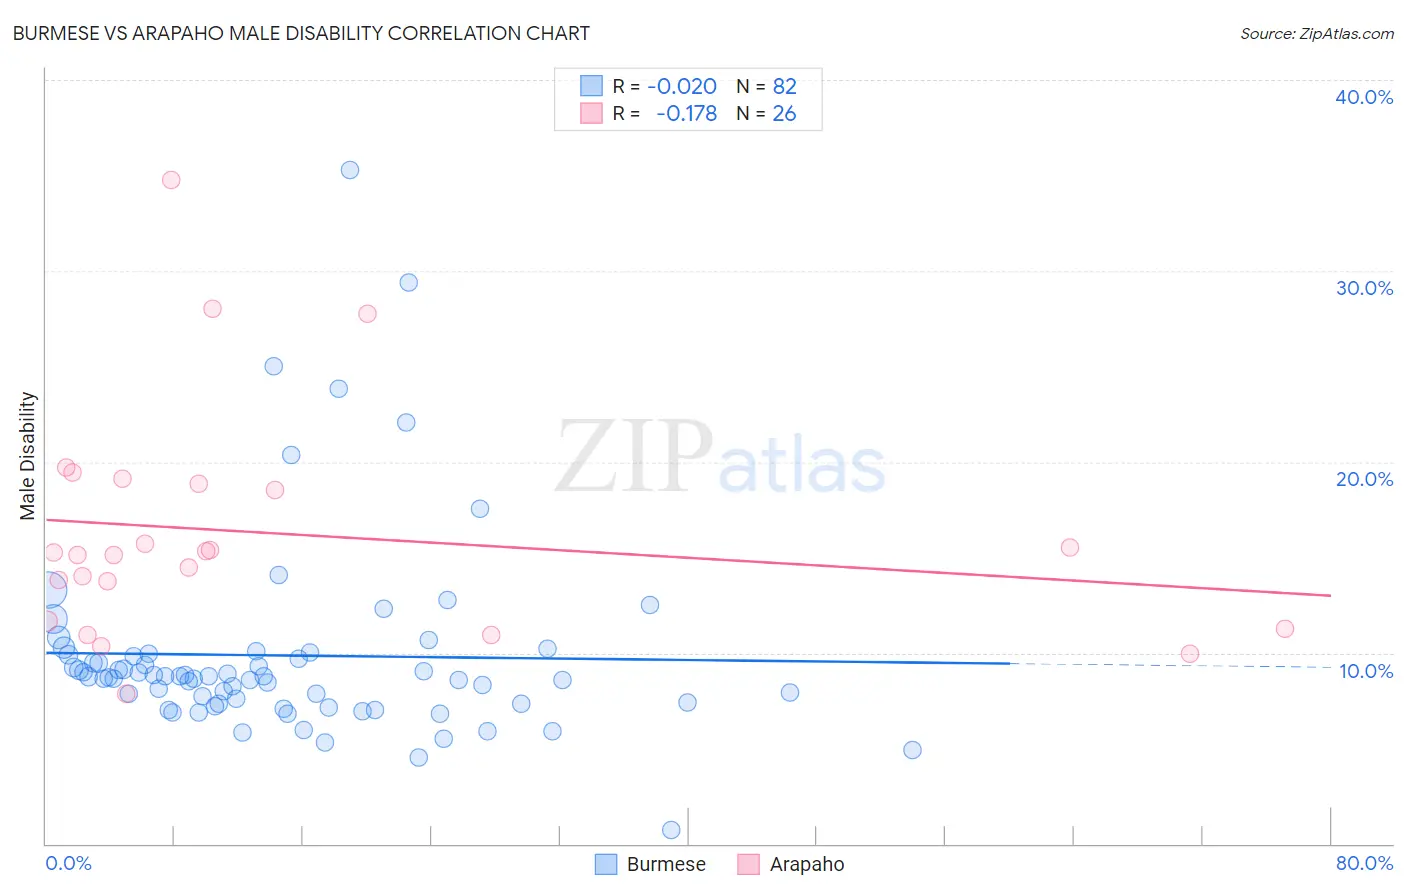
Burmese vs Arapaho Male Disability Correlation Chart
The statistical analysis conducted on geographies consisting of 465,271,159 people shows no correlation between the proportion of Burmese and percentage of males with a disability in the United States with a correlation coefficient (R) of -0.020 and weighted average of 10.0%. Similarly, the statistical analysis conducted on geographies consisting of 29,780,236 people shows a poor negative correlation between the proportion of Arapaho and percentage of males with a disability in the United States with a correlation coefficient (R) of -0.178 and weighted average of 13.3%, a difference of 33.7%.
Male Disability Correlation Summary
| Measurement | Burmese | Arapaho |
| Minimum | 0.74% | 7.9% |
| Maximum | 35.3% | 34.7% |
| Range | 34.6% | 26.9% |
| Mean | 9.9% | 16.3% |
| Median | 8.8% | 15.2% |
| Interquartile 25% (IQ1) | 7.3% | 11.6% |
| Interquartile 75% (IQ3) | 9.9% | 18.8% |
| Interquartile Range (IQR) | 2.6% | 7.2% |
| Standard Deviation (Sample) | 5.2% | 6.1% |
| Standard Deviation (Population) | 5.2% | 6.0% |
Similar Demographics by Male Disability
Demographics Similar to Burmese by Male Disability
In terms of male disability, the demographic groups most similar to Burmese are Asian (10.0%, a difference of 0.11%), Immigrants from Sri Lanka (10.0%, a difference of 0.16%), Immigrants from Venezuela (10.0%, a difference of 0.29%), Cypriot (10.0%, a difference of 0.38%), and Immigrants from Asia (10.0%, a difference of 0.51%).
| Demographics | Rating | Rank | Male Disability |
| Immigrants | Iran | 100.0 /100 | #14 | Exceptional 9.7% |
| Indians (Asian) | 100.0 /100 | #15 | Exceptional 9.7% |
| Okinawans | 100.0 /100 | #16 | Exceptional 9.8% |
| Immigrants | Korea | 100.0 /100 | #17 | Exceptional 9.8% |
| Immigrants | Pakistan | 100.0 /100 | #18 | Exceptional 9.8% |
| Immigrants | Sri Lanka | 100.0 /100 | #19 | Exceptional 10.0% |
| Asians | 100.0 /100 | #20 | Exceptional 10.0% |
| Burmese | 100.0 /100 | #21 | Exceptional 10.0% |
| Immigrants | Venezuela | 100.0 /100 | #22 | Exceptional 10.0% |
| Cypriots | 100.0 /100 | #23 | Exceptional 10.0% |
| Immigrants | Asia | 100.0 /100 | #24 | Exceptional 10.0% |
| Immigrants | Malaysia | 99.9 /100 | #25 | Exceptional 10.0% |
| Paraguayans | 99.9 /100 | #26 | Exceptional 10.1% |
| Egyptians | 99.9 /100 | #27 | Exceptional 10.1% |
| Vietnamese | 99.9 /100 | #28 | Exceptional 10.1% |
Demographics Similar to Arapaho by Male Disability
In terms of male disability, the demographic groups most similar to Arapaho are French American Indian (13.4%, a difference of 0.15%), Spanish American (13.3%, a difference of 0.22%), French Canadian (13.3%, a difference of 0.42%), Blackfeet (13.4%, a difference of 0.58%), and Immigrants from the Azores (13.4%, a difference of 0.72%).
| Demographics | Rating | Rank | Male Disability |
| Cheyenne | 0.0 /100 | #300 | Tragic 13.0% |
| French | 0.0 /100 | #301 | Tragic 13.0% |
| Crow | 0.0 /100 | #302 | Tragic 13.1% |
| Scotch-Irish | 0.0 /100 | #303 | Tragic 13.2% |
| Blacks/African Americans | 0.0 /100 | #304 | Tragic 13.2% |
| French Canadians | 0.0 /100 | #305 | Tragic 13.3% |
| Spanish Americans | 0.0 /100 | #306 | Tragic 13.3% |
| Arapaho | 0.0 /100 | #307 | Tragic 13.3% |
| French American Indians | 0.0 /100 | #308 | Tragic 13.4% |
| Blackfeet | 0.0 /100 | #309 | Tragic 13.4% |
| Immigrants | Azores | 0.0 /100 | #310 | Tragic 13.4% |
| Delaware | 0.0 /100 | #311 | Tragic 13.5% |
| Yakama | 0.0 /100 | #312 | Tragic 13.5% |
| Puget Sound Salish | 0.0 /100 | #313 | Tragic 13.5% |
| Aleuts | 0.0 /100 | #314 | Tragic 13.5% |