Immigrants from Costa Rica vs Arapaho Unemployment Among Ages 16 to 19 years
COMPARE
Immigrants from Costa Rica
Arapaho
Unemployment Among Ages 16 to 19 years
Unemployment Among Ages 16 to 19 years Comparison
Immigrants from Costa Rica
Arapaho
17.6%
UNEMPLOYMENT AMONG AGES 16 TO 19 YEARS
41.3/ 100
METRIC RATING
191st/ 347
METRIC RANK
25.2%
UNEMPLOYMENT AMONG AGES 16 TO 19 YEARS
0.0/ 100
METRIC RATING
335th/ 347
METRIC RANK
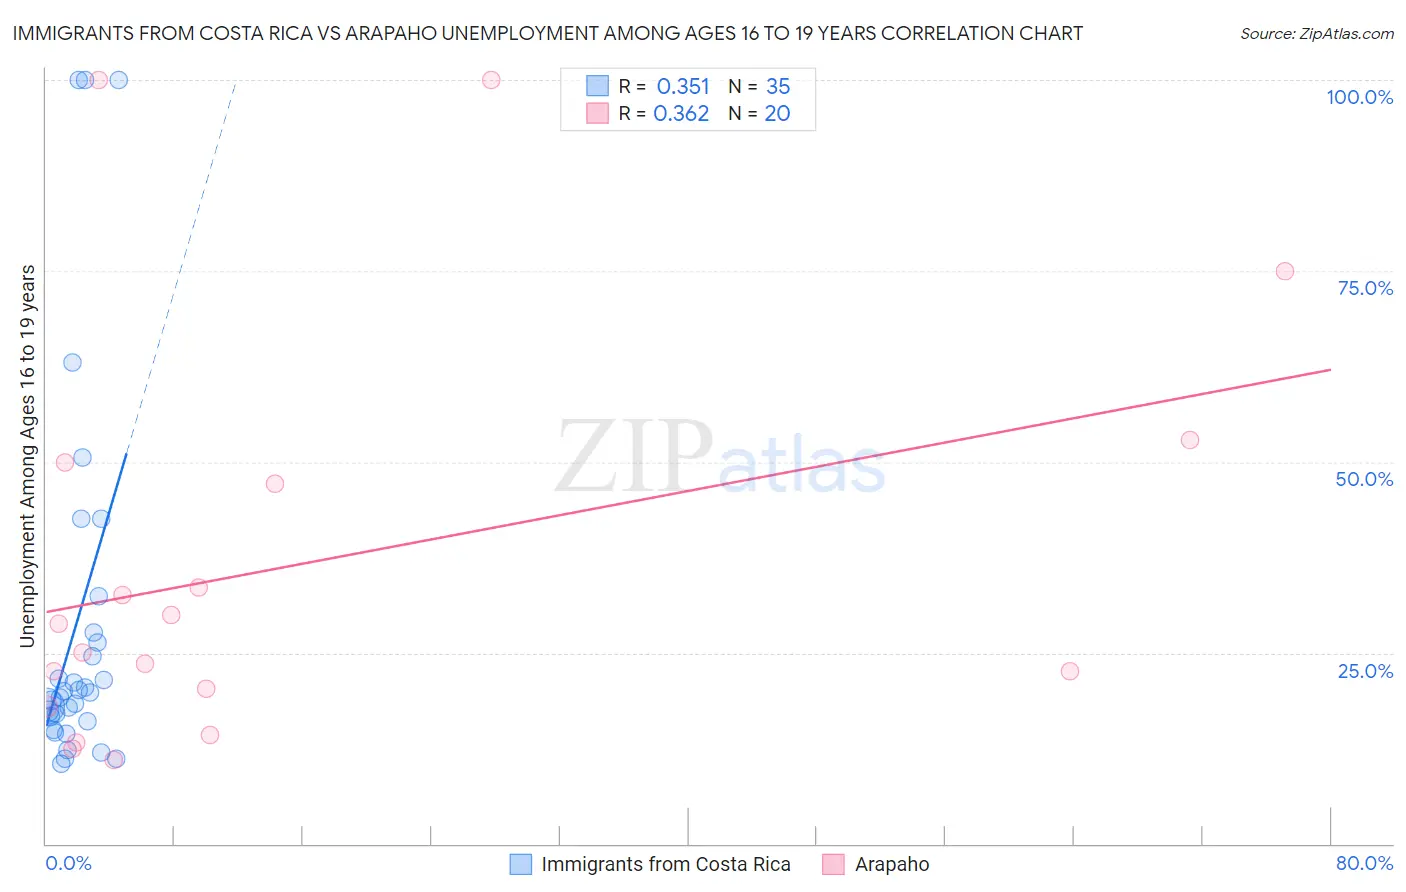
Immigrants from Costa Rica vs Arapaho Unemployment Among Ages 16 to 19 years Correlation Chart
The statistical analysis conducted on geographies consisting of 199,003,173 people shows a mild positive correlation between the proportion of Immigrants from Costa Rica and unemployment rate among population between the ages 16 and 19 in the United States with a correlation coefficient (R) of 0.351 and weighted average of 17.6%. Similarly, the statistical analysis conducted on geographies consisting of 29,524,713 people shows a mild positive correlation between the proportion of Arapaho and unemployment rate among population between the ages 16 and 19 in the United States with a correlation coefficient (R) of 0.362 and weighted average of 25.2%, a difference of 42.5%.
Unemployment Among Ages 16 to 19 years Correlation Summary
| Measurement | Immigrants from Costa Rica | Arapaho |
| Minimum | 10.4% | 10.9% |
| Maximum | 100.0% | 100.0% |
| Range | 89.6% | 89.1% |
| Mean | 29.0% | 36.6% |
| Median | 19.8% | 27.0% |
| Interquartile 25% (IQ1) | 16.1% | 19.2% |
| Interquartile 75% (IQ3) | 27.6% | 48.5% |
| Interquartile Range (IQR) | 11.5% | 29.4% |
| Standard Deviation (Sample) | 24.8% | 26.9% |
| Standard Deviation (Population) | 24.5% | 26.3% |
Similar Demographics by Unemployment Among Ages 16 to 19 years
Demographics Similar to Immigrants from Costa Rica by Unemployment Among Ages 16 to 19 years
In terms of unemployment among ages 16 to 19 years, the demographic groups most similar to Immigrants from Costa Rica are Marshallese (17.6%, a difference of 0.020%), Immigrants from Europe (17.6%, a difference of 0.030%), Immigrants from Philippines (17.7%, a difference of 0.030%), Immigrants from Australia (17.7%, a difference of 0.030%), and Immigrants from Nicaragua (17.6%, a difference of 0.040%).
| Demographics | Rating | Rank | Unemployment Among Ages 16 to 19 years |
| Eastern Europeans | 44.3 /100 | #184 | Average 17.6% |
| Iroquois | 43.4 /100 | #185 | Average 17.6% |
| Japanese | 43.2 /100 | #186 | Average 17.6% |
| Immigrants | Micronesia | 42.4 /100 | #187 | Average 17.6% |
| Immigrants | Nicaragua | 42.2 /100 | #188 | Average 17.6% |
| Immigrants | Europe | 41.8 /100 | #189 | Average 17.6% |
| Marshallese | 41.7 /100 | #190 | Average 17.6% |
| Immigrants | Costa Rica | 41.3 /100 | #191 | Average 17.6% |
| Immigrants | Philippines | 40.7 /100 | #192 | Average 17.7% |
| Immigrants | Australia | 40.6 /100 | #193 | Average 17.7% |
| Peruvians | 38.8 /100 | #194 | Fair 17.7% |
| Immigrants | Peru | 37.3 /100 | #195 | Fair 17.7% |
| Alaskan Athabascans | 34.1 /100 | #196 | Fair 17.7% |
| Immigrants | Czechoslovakia | 29.8 /100 | #197 | Fair 17.8% |
| Ethiopians | 29.6 /100 | #198 | Fair 17.8% |
Demographics Similar to Arapaho by Unemployment Among Ages 16 to 19 years
In terms of unemployment among ages 16 to 19 years, the demographic groups most similar to Arapaho are Kiowa (25.2%, a difference of 0.21%), Guyanese (24.8%, a difference of 1.3%), Immigrants from Guyana (25.5%, a difference of 1.3%), Immigrants from St. Vincent and the Grenadines (25.7%, a difference of 2.1%), and Immigrants from Grenada (25.7%, a difference of 2.3%).
| Demographics | Rating | Rank | Unemployment Among Ages 16 to 19 years |
| Immigrants | Dominican Republic | 0.0 /100 | #328 | Tragic 23.3% |
| Tlingit-Haida | 0.0 /100 | #329 | Tragic 23.5% |
| Dominicans | 0.0 /100 | #330 | Tragic 23.6% |
| British West Indians | 0.0 /100 | #331 | Tragic 24.0% |
| Immigrants | Barbados | 0.0 /100 | #332 | Tragic 24.0% |
| Paiute | 0.0 /100 | #333 | Tragic 24.4% |
| Guyanese | 0.0 /100 | #334 | Tragic 24.8% |
| Arapaho | 0.0 /100 | #335 | Tragic 25.2% |
| Kiowa | 0.0 /100 | #336 | Tragic 25.2% |
| Immigrants | Guyana | 0.0 /100 | #337 | Tragic 25.5% |
| Immigrants | St. Vincent and the Grenadines | 0.0 /100 | #338 | Tragic 25.7% |
| Immigrants | Grenada | 0.0 /100 | #339 | Tragic 25.7% |
| Crow | 0.0 /100 | #340 | Tragic 26.2% |
| Puerto Ricans | 0.0 /100 | #341 | Tragic 27.5% |
| Inupiat | 0.0 /100 | #342 | Tragic 28.1% |