Immigrants from Congo vs Russian Hearing Disability
COMPARE
Immigrants from Congo
Russian
Hearing Disability
Hearing Disability Comparison
Immigrants from Congo
Russians
2.9%
HEARING DISABILITY
78.9/ 100
METRIC RATING
145th/ 347
METRIC RANK
3.2%
HEARING DISABILITY
7.1/ 100
METRIC RATING
217th/ 347
METRIC RANK
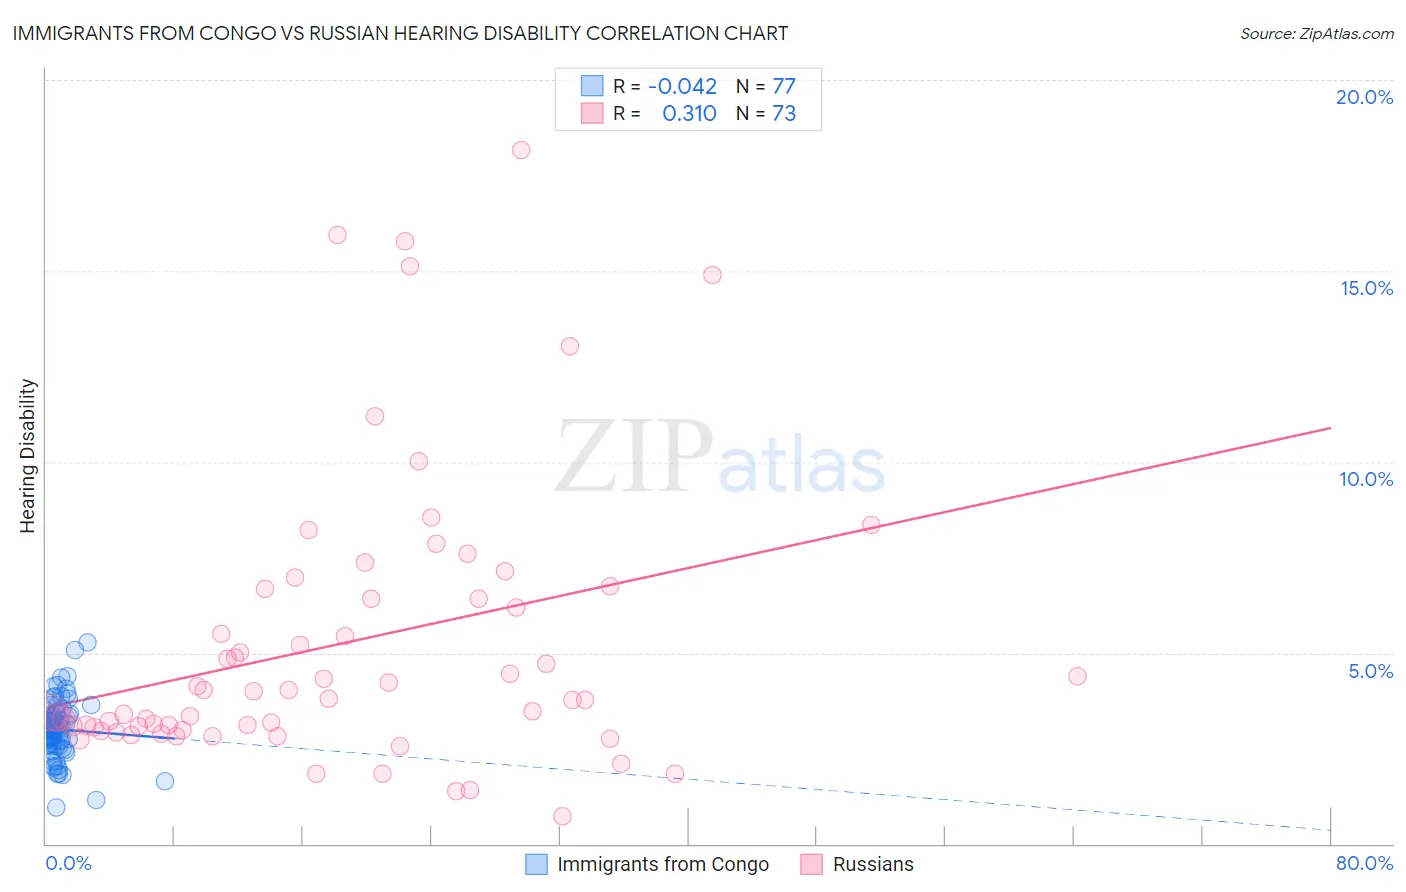
Immigrants from Congo vs Russian Hearing Disability Correlation Chart
The statistical analysis conducted on geographies consisting of 92,119,695 people shows no correlation between the proportion of Immigrants from Congo and percentage of population with hearing disability in the United States with a correlation coefficient (R) of -0.042 and weighted average of 2.9%. Similarly, the statistical analysis conducted on geographies consisting of 511,868,935 people shows a mild positive correlation between the proportion of Russians and percentage of population with hearing disability in the United States with a correlation coefficient (R) of 0.310 and weighted average of 3.2%, a difference of 9.4%.
Hearing Disability Correlation Summary
| Measurement | Immigrants from Congo | Russian |
| Minimum | 0.95% | 0.73% |
| Maximum | 5.3% | 18.2% |
| Range | 4.3% | 17.5% |
| Mean | 3.0% | 5.2% |
| Median | 3.0% | 3.8% |
| Interquartile 25% (IQ1) | 2.6% | 3.0% |
| Interquartile 75% (IQ3) | 3.4% | 6.5% |
| Interquartile Range (IQR) | 0.79% | 3.5% |
| Standard Deviation (Sample) | 0.77% | 3.7% |
| Standard Deviation (Population) | 0.77% | 3.7% |
Similar Demographics by Hearing Disability
Demographics Similar to Immigrants from Congo by Hearing Disability
In terms of hearing disability, the demographic groups most similar to Immigrants from Congo are Brazilian (2.9%, a difference of 0.020%), Tongan (2.9%, a difference of 0.030%), Immigrants from Bulgaria (2.9%, a difference of 0.050%), Immigrants from Russia (2.9%, a difference of 0.17%), and Immigrants from Panama (2.9%, a difference of 0.28%).
| Demographics | Rating | Rank | Hearing Disability |
| Immigrants | Costa Rica | 84.0 /100 | #138 | Excellent 2.9% |
| Bermudans | 83.8 /100 | #139 | Excellent 2.9% |
| Immigrants | Jordan | 83.7 /100 | #140 | Excellent 2.9% |
| Sub-Saharan Africans | 83.3 /100 | #141 | Excellent 2.9% |
| Laotians | 81.1 /100 | #142 | Excellent 2.9% |
| Immigrants | Bahamas | 80.9 /100 | #143 | Excellent 2.9% |
| Immigrants | Bulgaria | 79.2 /100 | #144 | Good 2.9% |
| Immigrants | Congo | 78.9 /100 | #145 | Good 2.9% |
| Brazilians | 78.7 /100 | #146 | Good 2.9% |
| Tongans | 78.6 /100 | #147 | Good 2.9% |
| Immigrants | Russia | 77.7 /100 | #148 | Good 2.9% |
| Immigrants | Panama | 76.9 /100 | #149 | Good 2.9% |
| Palestinians | 73.6 /100 | #150 | Good 2.9% |
| Immigrants | France | 73.1 /100 | #151 | Good 2.9% |
| Immigrants | Lithuania | 73.0 /100 | #152 | Good 2.9% |
Demographics Similar to Russians by Hearing Disability
In terms of hearing disability, the demographic groups most similar to Russians are Immigrants from Northern Europe (3.2%, a difference of 0.040%), Immigrants from Norway (3.2%, a difference of 0.080%), New Zealander (3.2%, a difference of 0.10%), Malaysian (3.2%, a difference of 0.16%), and Immigrants from Laos (3.2%, a difference of 0.16%).
| Demographics | Rating | Rank | Hearing Disability |
| Cape Verdeans | 12.2 /100 | #210 | Poor 3.1% |
| Romanians | 12.1 /100 | #211 | Poor 3.1% |
| Pakistanis | 11.1 /100 | #212 | Poor 3.1% |
| Immigrants | Iraq | 10.5 /100 | #213 | Poor 3.1% |
| Australians | 8.1 /100 | #214 | Tragic 3.2% |
| Bangladeshis | 8.1 /100 | #215 | Tragic 3.2% |
| Immigrants | Norway | 7.3 /100 | #216 | Tragic 3.2% |
| Russians | 7.1 /100 | #217 | Tragic 3.2% |
| Immigrants | Northern Europe | 7.0 /100 | #218 | Tragic 3.2% |
| New Zealanders | 6.8 /100 | #219 | Tragic 3.2% |
| Malaysians | 6.6 /100 | #220 | Tragic 3.2% |
| Immigrants | Laos | 6.6 /100 | #221 | Tragic 3.2% |
| Immigrants | Oceania | 6.5 /100 | #222 | Tragic 3.2% |
| Mexicans | 5.6 /100 | #223 | Tragic 3.2% |
| Icelanders | 5.2 /100 | #224 | Tragic 3.2% |