French American Indian vs Russian Hearing Disability
COMPARE
French American Indian
Russian
Hearing Disability
Hearing Disability Comparison
French American Indians
Russians
3.6%
HEARING DISABILITY
0.0/ 100
METRIC RATING
280th/ 347
METRIC RANK
3.2%
HEARING DISABILITY
7.1/ 100
METRIC RATING
217th/ 347
METRIC RANK
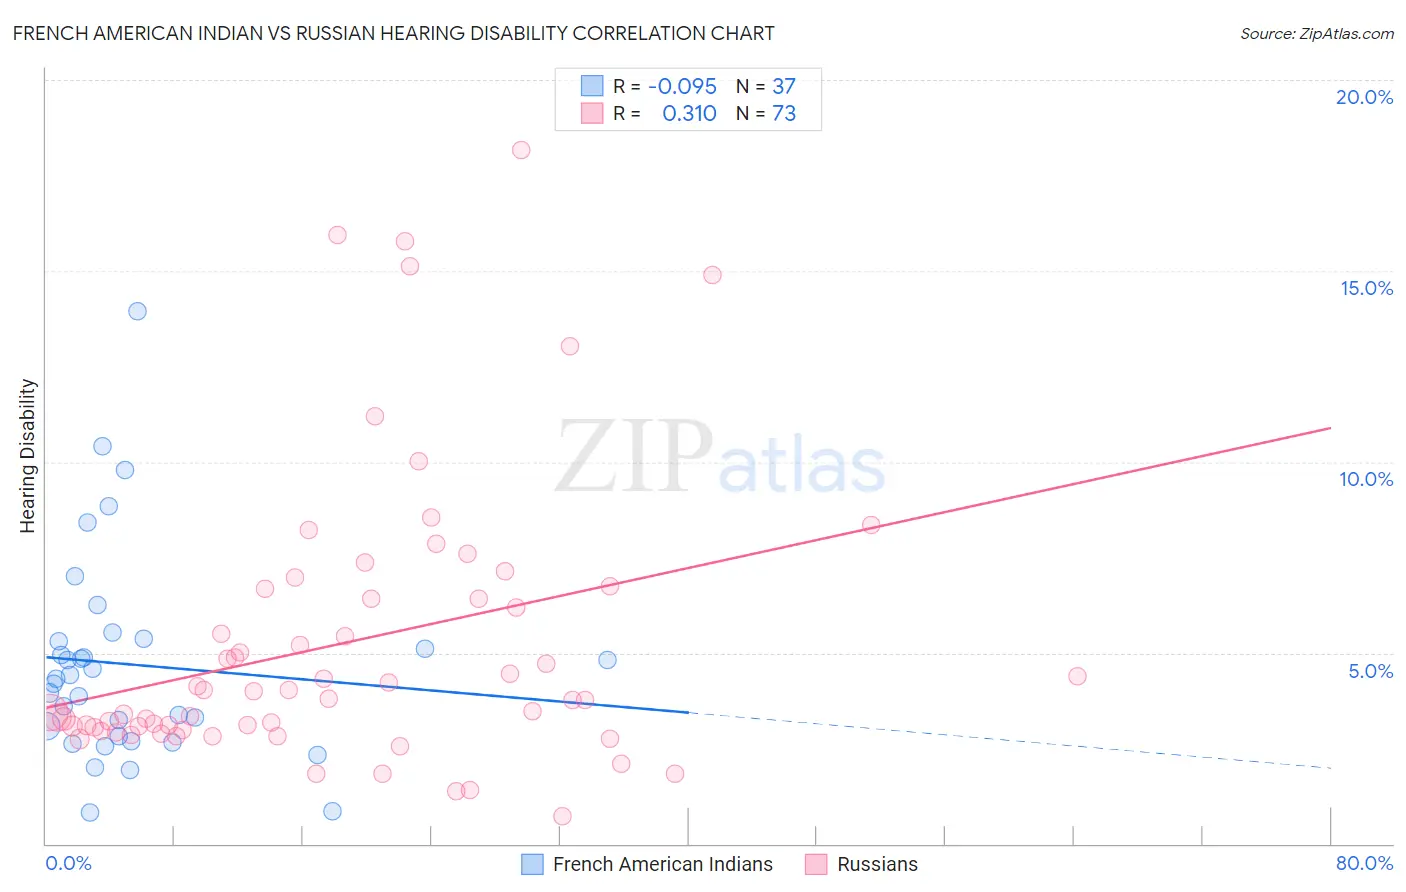
French American Indian vs Russian Hearing Disability Correlation Chart
The statistical analysis conducted on geographies consisting of 131,957,139 people shows a slight negative correlation between the proportion of French American Indians and percentage of population with hearing disability in the United States with a correlation coefficient (R) of -0.095 and weighted average of 3.6%. Similarly, the statistical analysis conducted on geographies consisting of 511,868,935 people shows a mild positive correlation between the proportion of Russians and percentage of population with hearing disability in the United States with a correlation coefficient (R) of 0.310 and weighted average of 3.2%, a difference of 13.5%.
Hearing Disability Correlation Summary
| Measurement | French American Indian | Russian |
| Minimum | 0.83% | 0.73% |
| Maximum | 14.0% | 18.2% |
| Range | 13.1% | 17.5% |
| Mean | 4.7% | 5.2% |
| Median | 4.3% | 3.8% |
| Interquartile 25% (IQ1) | 2.8% | 3.0% |
| Interquartile 75% (IQ3) | 5.3% | 6.5% |
| Interquartile Range (IQR) | 2.6% | 3.5% |
| Standard Deviation (Sample) | 2.7% | 3.7% |
| Standard Deviation (Population) | 2.7% | 3.7% |
Similar Demographics by Hearing Disability
Demographics Similar to French American Indians by Hearing Disability
In terms of hearing disability, the demographic groups most similar to French American Indians are Scandinavian (3.6%, a difference of 0.060%), Slovak (3.6%, a difference of 0.070%), Swedish (3.6%, a difference of 0.15%), Basque (3.6%, a difference of 0.33%), and Blackfeet (3.6%, a difference of 0.40%).
| Demographics | Rating | Rank | Hearing Disability |
| Puerto Ricans | 0.0 /100 | #273 | Tragic 3.5% |
| Swiss | 0.0 /100 | #274 | Tragic 3.5% |
| Czechoslovakians | 0.0 /100 | #275 | Tragic 3.6% |
| Danes | 0.0 /100 | #276 | Tragic 3.6% |
| Immigrants | Nonimmigrants | 0.0 /100 | #277 | Tragic 3.6% |
| Basques | 0.0 /100 | #278 | Tragic 3.6% |
| Slovaks | 0.0 /100 | #279 | Tragic 3.6% |
| French American Indians | 0.0 /100 | #280 | Tragic 3.6% |
| Scandinavians | 0.0 /100 | #281 | Tragic 3.6% |
| Swedes | 0.0 /100 | #282 | Tragic 3.6% |
| Blackfeet | 0.0 /100 | #283 | Tragic 3.6% |
| Immigrants | Micronesia | 0.0 /100 | #284 | Tragic 3.6% |
| Sioux | 0.0 /100 | #285 | Tragic 3.6% |
| Delaware | 0.0 /100 | #286 | Tragic 3.6% |
| Spanish | 0.0 /100 | #287 | Tragic 3.7% |
Demographics Similar to Russians by Hearing Disability
In terms of hearing disability, the demographic groups most similar to Russians are Immigrants from Northern Europe (3.2%, a difference of 0.040%), Immigrants from Norway (3.2%, a difference of 0.080%), New Zealander (3.2%, a difference of 0.10%), Malaysian (3.2%, a difference of 0.16%), and Immigrants from Laos (3.2%, a difference of 0.16%).
| Demographics | Rating | Rank | Hearing Disability |
| Cape Verdeans | 12.2 /100 | #210 | Poor 3.1% |
| Romanians | 12.1 /100 | #211 | Poor 3.1% |
| Pakistanis | 11.1 /100 | #212 | Poor 3.1% |
| Immigrants | Iraq | 10.5 /100 | #213 | Poor 3.1% |
| Australians | 8.1 /100 | #214 | Tragic 3.2% |
| Bangladeshis | 8.1 /100 | #215 | Tragic 3.2% |
| Immigrants | Norway | 7.3 /100 | #216 | Tragic 3.2% |
| Russians | 7.1 /100 | #217 | Tragic 3.2% |
| Immigrants | Northern Europe | 7.0 /100 | #218 | Tragic 3.2% |
| New Zealanders | 6.8 /100 | #219 | Tragic 3.2% |
| Malaysians | 6.6 /100 | #220 | Tragic 3.2% |
| Immigrants | Laos | 6.6 /100 | #221 | Tragic 3.2% |
| Immigrants | Oceania | 6.5 /100 | #222 | Tragic 3.2% |
| Mexicans | 5.6 /100 | #223 | Tragic 3.2% |
| Icelanders | 5.2 /100 | #224 | Tragic 3.2% |