Immigrants from Eastern Africa vs Russian Hearing Disability
COMPARE
Immigrants from Eastern Africa
Russian
Hearing Disability
Hearing Disability Comparison
Immigrants from Eastern Africa
Russians
2.8%
HEARING DISABILITY
95.0/ 100
METRIC RATING
100th/ 347
METRIC RANK
3.2%
HEARING DISABILITY
7.1/ 100
METRIC RATING
217th/ 347
METRIC RANK
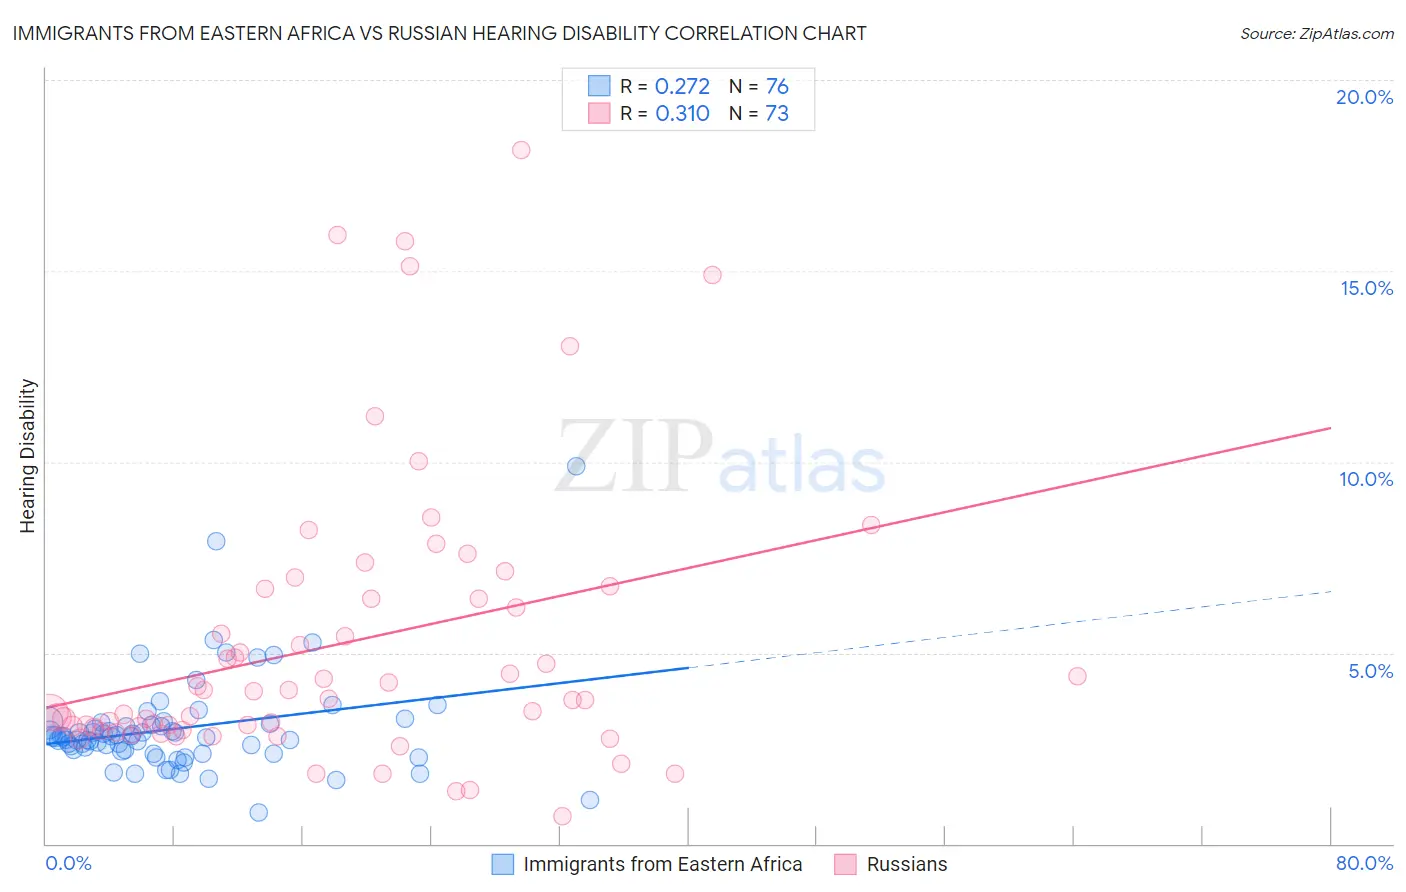
Immigrants from Eastern Africa vs Russian Hearing Disability Correlation Chart
The statistical analysis conducted on geographies consisting of 355,030,824 people shows a weak positive correlation between the proportion of Immigrants from Eastern Africa and percentage of population with hearing disability in the United States with a correlation coefficient (R) of 0.272 and weighted average of 2.8%. Similarly, the statistical analysis conducted on geographies consisting of 511,868,935 people shows a mild positive correlation between the proportion of Russians and percentage of population with hearing disability in the United States with a correlation coefficient (R) of 0.310 and weighted average of 3.2%, a difference of 13.9%.
Hearing Disability Correlation Summary
| Measurement | Immigrants from Eastern Africa | Russian |
| Minimum | 0.83% | 0.73% |
| Maximum | 9.9% | 18.2% |
| Range | 9.1% | 17.5% |
| Mean | 3.0% | 5.2% |
| Median | 2.8% | 3.8% |
| Interquartile 25% (IQ1) | 2.4% | 3.0% |
| Interquartile 75% (IQ3) | 3.1% | 6.5% |
| Interquartile Range (IQR) | 0.68% | 3.5% |
| Standard Deviation (Sample) | 1.3% | 3.7% |
| Standard Deviation (Population) | 1.3% | 3.7% |
Similar Demographics by Hearing Disability
Demographics Similar to Immigrants from Eastern Africa by Hearing Disability
In terms of hearing disability, the demographic groups most similar to Immigrants from Eastern Africa are Immigrants from Guatemala (2.8%, a difference of 0.050%), Immigrants from Spain (2.8%, a difference of 0.050%), Taiwanese (2.8%, a difference of 0.070%), Immigrants from Honduras (2.8%, a difference of 0.090%), and Immigrants from Indonesia (2.8%, a difference of 0.12%).
| Demographics | Rating | Rank | Hearing Disability |
| Immigrants | Kuwait | 96.3 /100 | #93 | Exceptional 2.8% |
| Uruguayans | 95.9 /100 | #94 | Exceptional 2.8% |
| Israelis | 95.9 /100 | #95 | Exceptional 2.8% |
| Immigrants | Somalia | 95.5 /100 | #96 | Exceptional 2.8% |
| Immigrants | Afghanistan | 95.3 /100 | #97 | Exceptional 2.8% |
| Immigrants | Honduras | 95.1 /100 | #98 | Exceptional 2.8% |
| Immigrants | Guatemala | 95.1 /100 | #99 | Exceptional 2.8% |
| Immigrants | Eastern Africa | 95.0 /100 | #100 | Exceptional 2.8% |
| Immigrants | Spain | 94.9 /100 | #101 | Exceptional 2.8% |
| Taiwanese | 94.8 /100 | #102 | Exceptional 2.8% |
| Immigrants | Indonesia | 94.7 /100 | #103 | Exceptional 2.8% |
| Burmese | 94.2 /100 | #104 | Exceptional 2.8% |
| Moroccans | 93.9 /100 | #105 | Exceptional 2.8% |
| Hondurans | 93.4 /100 | #106 | Exceptional 2.8% |
| Immigrants | Chile | 93.4 /100 | #107 | Exceptional 2.8% |
Demographics Similar to Russians by Hearing Disability
In terms of hearing disability, the demographic groups most similar to Russians are Immigrants from Northern Europe (3.2%, a difference of 0.040%), Immigrants from Norway (3.2%, a difference of 0.080%), New Zealander (3.2%, a difference of 0.10%), Malaysian (3.2%, a difference of 0.16%), and Immigrants from Laos (3.2%, a difference of 0.16%).
| Demographics | Rating | Rank | Hearing Disability |
| Cape Verdeans | 12.2 /100 | #210 | Poor 3.1% |
| Romanians | 12.1 /100 | #211 | Poor 3.1% |
| Pakistanis | 11.1 /100 | #212 | Poor 3.1% |
| Immigrants | Iraq | 10.5 /100 | #213 | Poor 3.1% |
| Australians | 8.1 /100 | #214 | Tragic 3.2% |
| Bangladeshis | 8.1 /100 | #215 | Tragic 3.2% |
| Immigrants | Norway | 7.3 /100 | #216 | Tragic 3.2% |
| Russians | 7.1 /100 | #217 | Tragic 3.2% |
| Immigrants | Northern Europe | 7.0 /100 | #218 | Tragic 3.2% |
| New Zealanders | 6.8 /100 | #219 | Tragic 3.2% |
| Malaysians | 6.6 /100 | #220 | Tragic 3.2% |
| Immigrants | Laos | 6.6 /100 | #221 | Tragic 3.2% |
| Immigrants | Oceania | 6.5 /100 | #222 | Tragic 3.2% |
| Mexicans | 5.6 /100 | #223 | Tragic 3.2% |
| Icelanders | 5.2 /100 | #224 | Tragic 3.2% |