Immigrants from Congo vs Immigrants from South Central Asia Hearing Disability
COMPARE
Immigrants from Congo
Immigrants from South Central Asia
Hearing Disability
Hearing Disability Comparison
Immigrants from Congo
Immigrants from South Central Asia
2.9%
HEARING DISABILITY
78.9/ 100
METRIC RATING
145th/ 347
METRIC RANK
2.6%
HEARING DISABILITY
99.7/ 100
METRIC RATING
27th/ 347
METRIC RANK
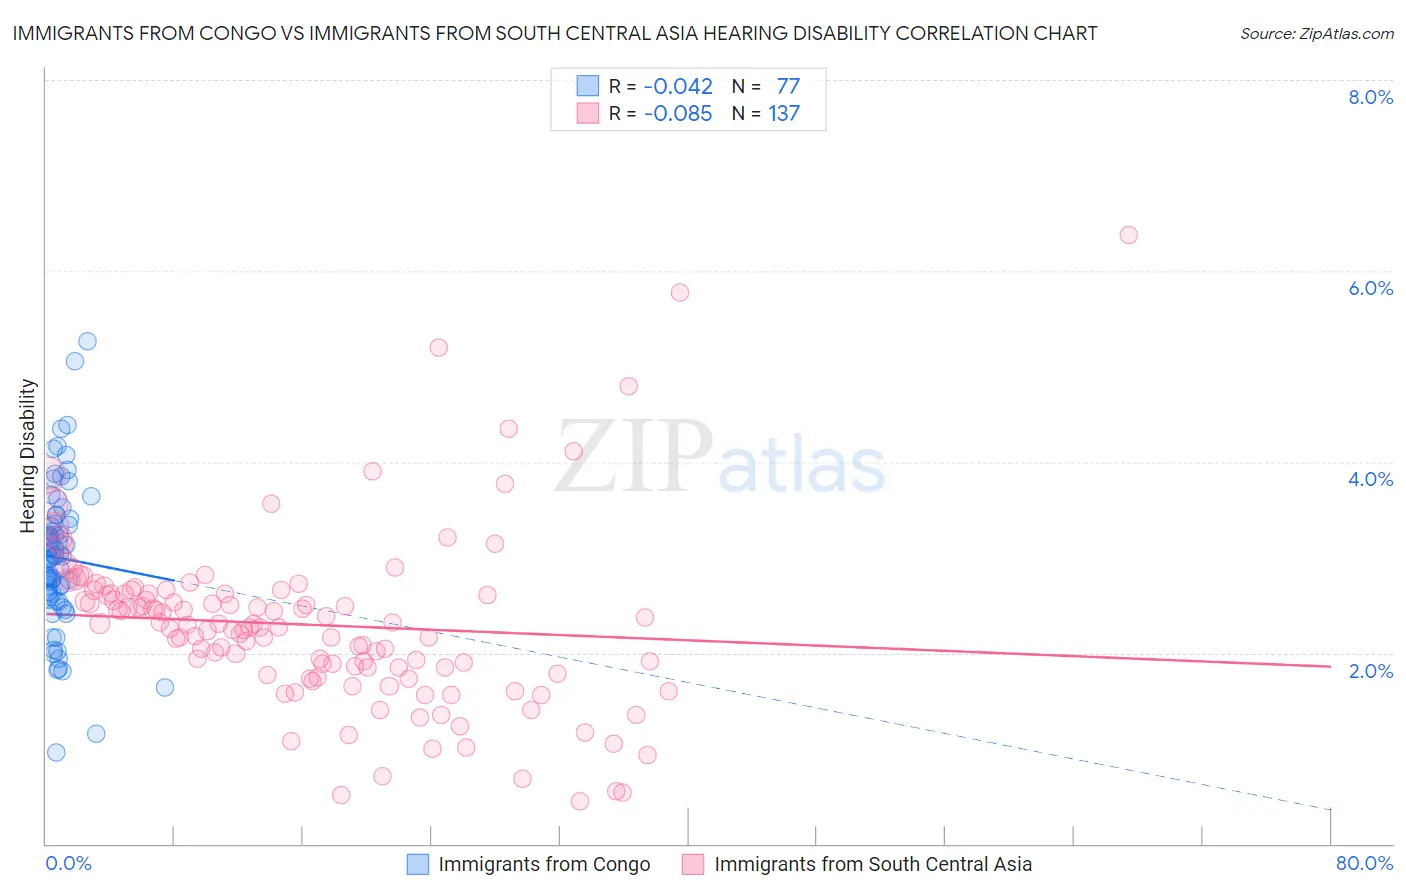
Immigrants from Congo vs Immigrants from South Central Asia Hearing Disability Correlation Chart
The statistical analysis conducted on geographies consisting of 92,119,695 people shows no correlation between the proportion of Immigrants from Congo and percentage of population with hearing disability in the United States with a correlation coefficient (R) of -0.042 and weighted average of 2.9%. Similarly, the statistical analysis conducted on geographies consisting of 472,823,945 people shows a slight negative correlation between the proportion of Immigrants from South Central Asia and percentage of population with hearing disability in the United States with a correlation coefficient (R) of -0.085 and weighted average of 2.6%, a difference of 12.4%.
Hearing Disability Correlation Summary
| Measurement | Immigrants from Congo | Immigrants from South Central Asia |
| Minimum | 0.95% | 0.44% |
| Maximum | 5.3% | 6.4% |
| Range | 4.3% | 5.9% |
| Mean | 3.0% | 2.3% |
| Median | 3.0% | 2.3% |
| Interquartile 25% (IQ1) | 2.6% | 1.8% |
| Interquartile 75% (IQ3) | 3.4% | 2.6% |
| Interquartile Range (IQR) | 0.79% | 0.81% |
| Standard Deviation (Sample) | 0.77% | 0.91% |
| Standard Deviation (Population) | 0.77% | 0.91% |
Similar Demographics by Hearing Disability
Demographics Similar to Immigrants from Congo by Hearing Disability
In terms of hearing disability, the demographic groups most similar to Immigrants from Congo are Brazilian (2.9%, a difference of 0.020%), Tongan (2.9%, a difference of 0.030%), Immigrants from Bulgaria (2.9%, a difference of 0.050%), Immigrants from Russia (2.9%, a difference of 0.17%), and Immigrants from Panama (2.9%, a difference of 0.28%).
| Demographics | Rating | Rank | Hearing Disability |
| Immigrants | Costa Rica | 84.0 /100 | #138 | Excellent 2.9% |
| Bermudans | 83.8 /100 | #139 | Excellent 2.9% |
| Immigrants | Jordan | 83.7 /100 | #140 | Excellent 2.9% |
| Sub-Saharan Africans | 83.3 /100 | #141 | Excellent 2.9% |
| Laotians | 81.1 /100 | #142 | Excellent 2.9% |
| Immigrants | Bahamas | 80.9 /100 | #143 | Excellent 2.9% |
| Immigrants | Bulgaria | 79.2 /100 | #144 | Good 2.9% |
| Immigrants | Congo | 78.9 /100 | #145 | Good 2.9% |
| Brazilians | 78.7 /100 | #146 | Good 2.9% |
| Tongans | 78.6 /100 | #147 | Good 2.9% |
| Immigrants | Russia | 77.7 /100 | #148 | Good 2.9% |
| Immigrants | Panama | 76.9 /100 | #149 | Good 2.9% |
| Palestinians | 73.6 /100 | #150 | Good 2.9% |
| Immigrants | France | 73.1 /100 | #151 | Good 2.9% |
| Immigrants | Lithuania | 73.0 /100 | #152 | Good 2.9% |
Demographics Similar to Immigrants from South Central Asia by Hearing Disability
In terms of hearing disability, the demographic groups most similar to Immigrants from South Central Asia are Immigrants from Senegal (2.6%, a difference of 0.040%), Immigrants from El Salvador (2.6%, a difference of 0.050%), Immigrants from Haiti (2.6%, a difference of 0.37%), Bolivian (2.6%, a difference of 0.40%), and Immigrants from Ghana (2.6%, a difference of 0.45%).
| Demographics | Rating | Rank | Hearing Disability |
| Immigrants | Bolivia | 99.8 /100 | #20 | Exceptional 2.5% |
| Ghanaians | 99.8 /100 | #21 | Exceptional 2.5% |
| Immigrants | Sierra Leone | 99.8 /100 | #22 | Exceptional 2.6% |
| Immigrants | Nigeria | 99.8 /100 | #23 | Exceptional 2.6% |
| Immigrants | Ghana | 99.8 /100 | #24 | Exceptional 2.6% |
| Immigrants | El Salvador | 99.7 /100 | #25 | Exceptional 2.6% |
| Immigrants | Senegal | 99.7 /100 | #26 | Exceptional 2.6% |
| Immigrants | South Central Asia | 99.7 /100 | #27 | Exceptional 2.6% |
| Immigrants | Haiti | 99.7 /100 | #28 | Exceptional 2.6% |
| Bolivians | 99.7 /100 | #29 | Exceptional 2.6% |
| Immigrants | Caribbean | 99.7 /100 | #30 | Exceptional 2.6% |
| Immigrants | Cameroon | 99.7 /100 | #31 | Exceptional 2.6% |
| Immigrants | Venezuela | 99.7 /100 | #32 | Exceptional 2.6% |
| Filipinos | 99.6 /100 | #33 | Exceptional 2.6% |
| Immigrants | Pakistan | 99.6 /100 | #34 | Exceptional 2.6% |