Immigrants from Congo vs Immigrants from Ecuador Hearing Disability
COMPARE
Immigrants from Congo
Immigrants from Ecuador
Hearing Disability
Hearing Disability Comparison
Immigrants from Congo
Immigrants from Ecuador
2.9%
HEARING DISABILITY
78.9/ 100
METRIC RATING
145th/ 347
METRIC RANK
2.5%
HEARING DISABILITY
99.9/ 100
METRIC RATING
10th/ 347
METRIC RANK
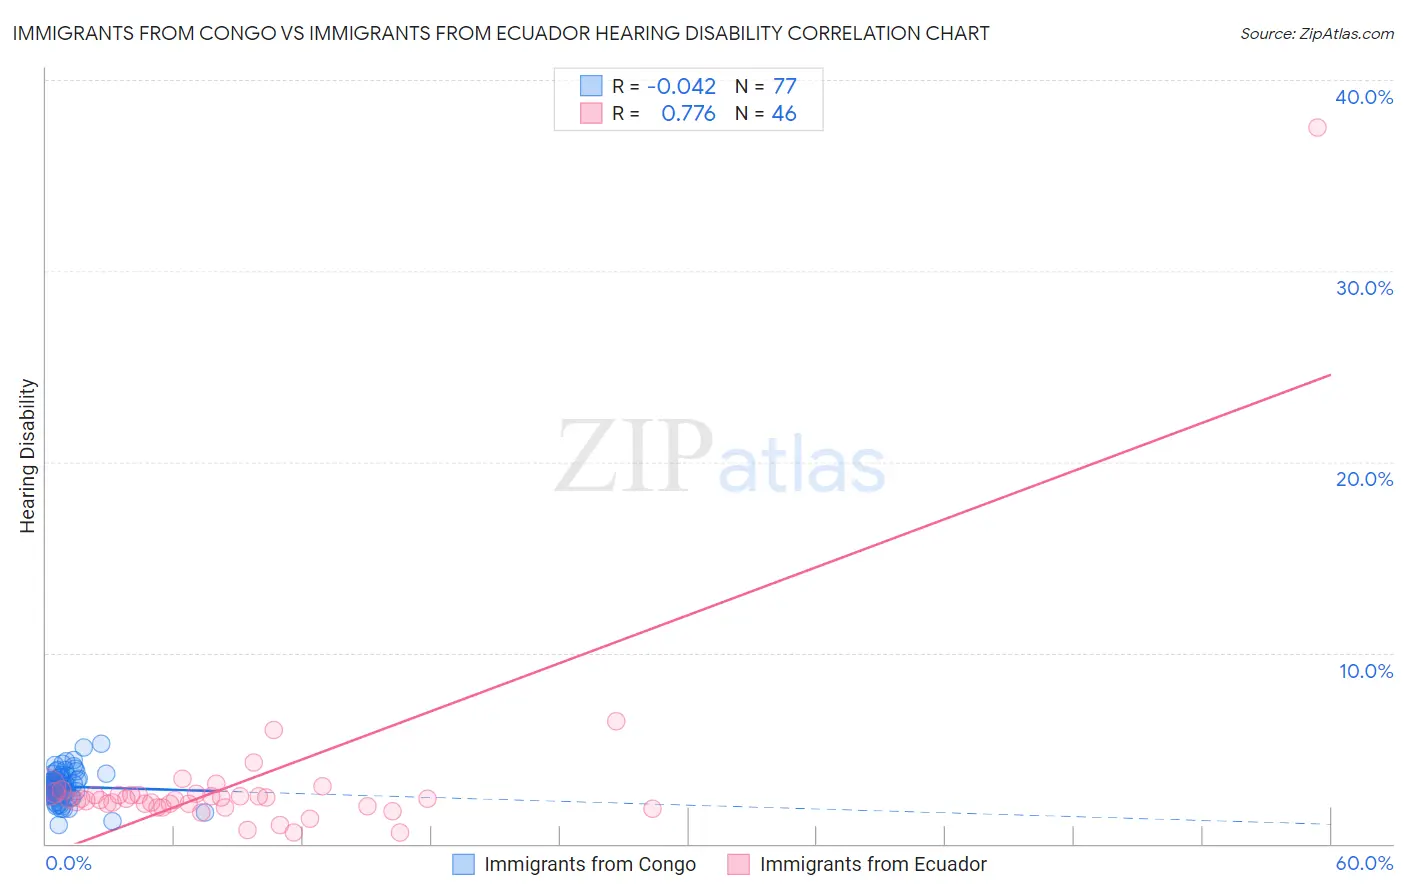
Immigrants from Congo vs Immigrants from Ecuador Hearing Disability Correlation Chart
The statistical analysis conducted on geographies consisting of 92,119,695 people shows no correlation between the proportion of Immigrants from Congo and percentage of population with hearing disability in the United States with a correlation coefficient (R) of -0.042 and weighted average of 2.9%. Similarly, the statistical analysis conducted on geographies consisting of 270,917,145 people shows a strong positive correlation between the proportion of Immigrants from Ecuador and percentage of population with hearing disability in the United States with a correlation coefficient (R) of 0.776 and weighted average of 2.5%, a difference of 17.3%.
Hearing Disability Correlation Summary
| Measurement | Immigrants from Congo | Immigrants from Ecuador |
| Minimum | 0.95% | 0.57% |
| Maximum | 5.3% | 37.5% |
| Range | 4.3% | 36.9% |
| Mean | 3.0% | 3.2% |
| Median | 3.0% | 2.3% |
| Interquartile 25% (IQ1) | 2.6% | 2.0% |
| Interquartile 75% (IQ3) | 3.4% | 2.6% |
| Interquartile Range (IQR) | 0.79% | 0.59% |
| Standard Deviation (Sample) | 0.77% | 5.3% |
| Standard Deviation (Population) | 0.77% | 5.2% |
Similar Demographics by Hearing Disability
Demographics Similar to Immigrants from Congo by Hearing Disability
In terms of hearing disability, the demographic groups most similar to Immigrants from Congo are Brazilian (2.9%, a difference of 0.020%), Tongan (2.9%, a difference of 0.030%), Immigrants from Bulgaria (2.9%, a difference of 0.050%), Immigrants from Russia (2.9%, a difference of 0.17%), and Immigrants from Panama (2.9%, a difference of 0.28%).
| Demographics | Rating | Rank | Hearing Disability |
| Immigrants | Costa Rica | 84.0 /100 | #138 | Excellent 2.9% |
| Bermudans | 83.8 /100 | #139 | Excellent 2.9% |
| Immigrants | Jordan | 83.7 /100 | #140 | Excellent 2.9% |
| Sub-Saharan Africans | 83.3 /100 | #141 | Excellent 2.9% |
| Laotians | 81.1 /100 | #142 | Excellent 2.9% |
| Immigrants | Bahamas | 80.9 /100 | #143 | Excellent 2.9% |
| Immigrants | Bulgaria | 79.2 /100 | #144 | Good 2.9% |
| Immigrants | Congo | 78.9 /100 | #145 | Good 2.9% |
| Brazilians | 78.7 /100 | #146 | Good 2.9% |
| Tongans | 78.6 /100 | #147 | Good 2.9% |
| Immigrants | Russia | 77.7 /100 | #148 | Good 2.9% |
| Immigrants | Panama | 76.9 /100 | #149 | Good 2.9% |
| Palestinians | 73.6 /100 | #150 | Good 2.9% |
| Immigrants | France | 73.1 /100 | #151 | Good 2.9% |
| Immigrants | Lithuania | 73.0 /100 | #152 | Good 2.9% |
Demographics Similar to Immigrants from Ecuador by Hearing Disability
In terms of hearing disability, the demographic groups most similar to Immigrants from Ecuador are Immigrants from Trinidad and Tobago (2.5%, a difference of 0.55%), Trinidadian and Tobagonian (2.5%, a difference of 0.86%), Immigrants from Dominican Republic (2.4%, a difference of 1.0%), Sierra Leonean (2.5%, a difference of 1.1%), and Ecuadorian (2.5%, a difference of 1.4%).
| Demographics | Rating | Rank | Hearing Disability |
| Guyanese | 100.0 /100 | #3 | Exceptional 2.3% |
| Immigrants | Guyana | 100.0 /100 | #4 | Exceptional 2.3% |
| Immigrants | Barbados | 100.0 /100 | #5 | Exceptional 2.4% |
| Vietnamese | 100.0 /100 | #6 | Exceptional 2.4% |
| Immigrants | Bangladesh | 100.0 /100 | #7 | Exceptional 2.4% |
| British West Indians | 100.0 /100 | #8 | Exceptional 2.4% |
| Immigrants | Dominican Republic | 100.0 /100 | #9 | Exceptional 2.4% |
| Immigrants | Ecuador | 99.9 /100 | #10 | Exceptional 2.5% |
| Immigrants | Trinidad and Tobago | 99.9 /100 | #11 | Exceptional 2.5% |
| Trinidadians and Tobagonians | 99.9 /100 | #12 | Exceptional 2.5% |
| Sierra Leoneans | 99.9 /100 | #13 | Exceptional 2.5% |
| Ecuadorians | 99.9 /100 | #14 | Exceptional 2.5% |
| Barbadians | 99.9 /100 | #15 | Exceptional 2.5% |
| Immigrants | West Indies | 99.9 /100 | #16 | Exceptional 2.5% |
| Immigrants | India | 99.9 /100 | #17 | Exceptional 2.5% |