Immigrants from Congo vs Russian Doctorate Degree
COMPARE
Immigrants from Congo
Russian
Doctorate Degree
Doctorate Degree Comparison
Immigrants from Congo
Russians
1.6%
DOCTORATE DEGREE
2.6/ 100
METRIC RATING
238th/ 347
METRIC RANK
2.6%
DOCTORATE DEGREE
100.0/ 100
METRIC RATING
38th/ 347
METRIC RANK
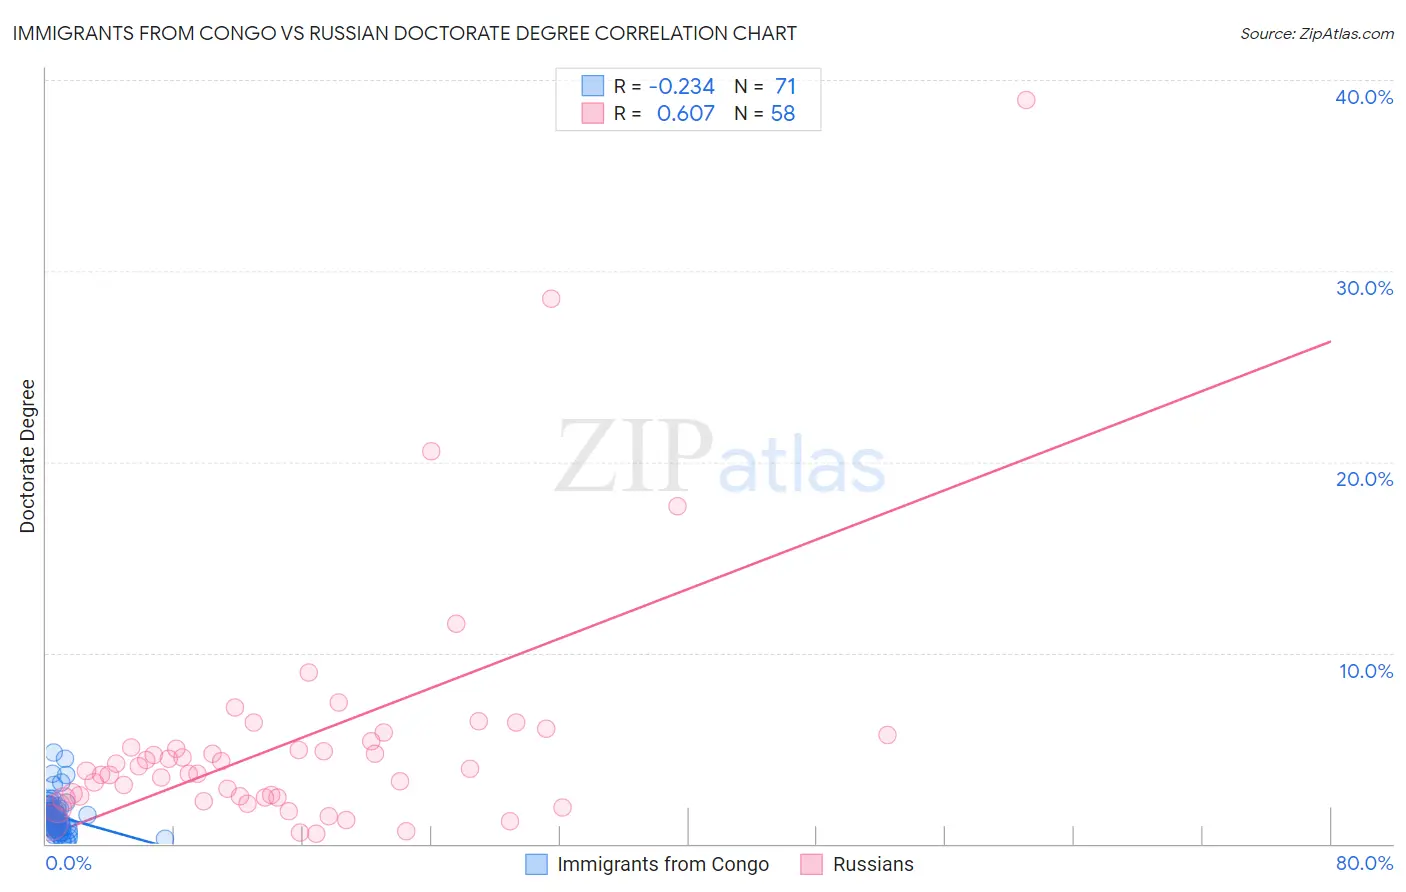
Immigrants from Congo vs Russian Doctorate Degree Correlation Chart
The statistical analysis conducted on geographies consisting of 91,930,885 people shows a weak negative correlation between the proportion of Immigrants from Congo and percentage of population with at least doctorate degree education in the United States with a correlation coefficient (R) of -0.234 and weighted average of 1.6%. Similarly, the statistical analysis conducted on geographies consisting of 501,018,326 people shows a significant positive correlation between the proportion of Russians and percentage of population with at least doctorate degree education in the United States with a correlation coefficient (R) of 0.607 and weighted average of 2.6%, a difference of 60.1%.
Doctorate Degree Correlation Summary
| Measurement | Immigrants from Congo | Russian |
| Minimum | 0.075% | 0.50% |
| Maximum | 4.8% | 39.0% |
| Range | 4.7% | 38.5% |
| Mean | 1.4% | 5.4% |
| Median | 1.3% | 3.9% |
| Interquartile 25% (IQ1) | 0.80% | 2.4% |
| Interquartile 75% (IQ3) | 1.8% | 5.4% |
| Interquartile Range (IQR) | 1.0% | 2.9% |
| Standard Deviation (Sample) | 0.94% | 6.5% |
| Standard Deviation (Population) | 0.93% | 6.4% |
Similar Demographics by Doctorate Degree
Demographics Similar to Immigrants from Congo by Doctorate Degree
In terms of doctorate degree, the demographic groups most similar to Immigrants from Congo are West Indian (1.6%, a difference of 0.10%), Iroquois (1.6%, a difference of 0.20%), Immigrants from Panama (1.6%, a difference of 0.29%), Indonesian (1.6%, a difference of 0.39%), and Cheyenne (1.6%, a difference of 0.48%).
| Demographics | Rating | Rank | Doctorate Degree |
| Immigrants | North Macedonia | 3.9 /100 | #231 | Tragic 1.6% |
| Guamanians/Chamorros | 3.3 /100 | #232 | Tragic 1.6% |
| Barbadians | 3.3 /100 | #233 | Tragic 1.6% |
| Hopi | 3.2 /100 | #234 | Tragic 1.6% |
| Cree | 3.0 /100 | #235 | Tragic 1.6% |
| Indonesians | 2.8 /100 | #236 | Tragic 1.6% |
| Iroquois | 2.7 /100 | #237 | Tragic 1.6% |
| Immigrants | Congo | 2.6 /100 | #238 | Tragic 1.6% |
| West Indians | 2.5 /100 | #239 | Tragic 1.6% |
| Immigrants | Panama | 2.4 /100 | #240 | Tragic 1.6% |
| Cheyenne | 2.3 /100 | #241 | Tragic 1.6% |
| Ottawa | 2.2 /100 | #242 | Tragic 1.6% |
| Native Hawaiians | 2.1 /100 | #243 | Tragic 1.6% |
| French American Indians | 2.0 /100 | #244 | Tragic 1.6% |
| Delaware | 1.9 /100 | #245 | Tragic 1.6% |
Demographics Similar to Russians by Doctorate Degree
In terms of doctorate degree, the demographic groups most similar to Russians are Immigrants from Kuwait (2.6%, a difference of 0.15%), Immigrants from Spain (2.6%, a difference of 0.42%), Immigrants from Malaysia (2.6%, a difference of 0.48%), Immigrants from Ireland (2.5%, a difference of 0.49%), and Cypriot (2.6%, a difference of 0.53%).
| Demographics | Rating | Rank | Doctorate Degree |
| Latvians | 100.0 /100 | #31 | Exceptional 2.6% |
| Immigrants | Northern Europe | 100.0 /100 | #32 | Exceptional 2.6% |
| Cambodians | 100.0 /100 | #33 | Exceptional 2.6% |
| Cypriots | 100.0 /100 | #34 | Exceptional 2.6% |
| Immigrants | Malaysia | 100.0 /100 | #35 | Exceptional 2.6% |
| Immigrants | Spain | 100.0 /100 | #36 | Exceptional 2.6% |
| Immigrants | Kuwait | 100.0 /100 | #37 | Exceptional 2.6% |
| Russians | 100.0 /100 | #38 | Exceptional 2.6% |
| Immigrants | Ireland | 100.0 /100 | #39 | Exceptional 2.5% |
| Estonians | 100.0 /100 | #40 | Exceptional 2.5% |
| Immigrants | Russia | 100.0 /100 | #41 | Exceptional 2.5% |
| New Zealanders | 100.0 /100 | #42 | Exceptional 2.5% |
| Soviet Union | 100.0 /100 | #43 | Exceptional 2.5% |
| Immigrants | Netherlands | 100.0 /100 | #44 | Exceptional 2.5% |
| Immigrants | South Africa | 100.0 /100 | #45 | Exceptional 2.4% |