Immigrants from Congo vs Choctaw Self-Care Disability
COMPARE
Immigrants from Congo
Choctaw
Self-Care Disability
Self-Care Disability Comparison
Immigrants from Congo
Choctaw
2.4%
SELF-CARE DISABILITY
98.0/ 100
METRIC RATING
89th/ 347
METRIC RANK
3.0%
SELF-CARE DISABILITY
0.0/ 100
METRIC RATING
337th/ 347
METRIC RANK
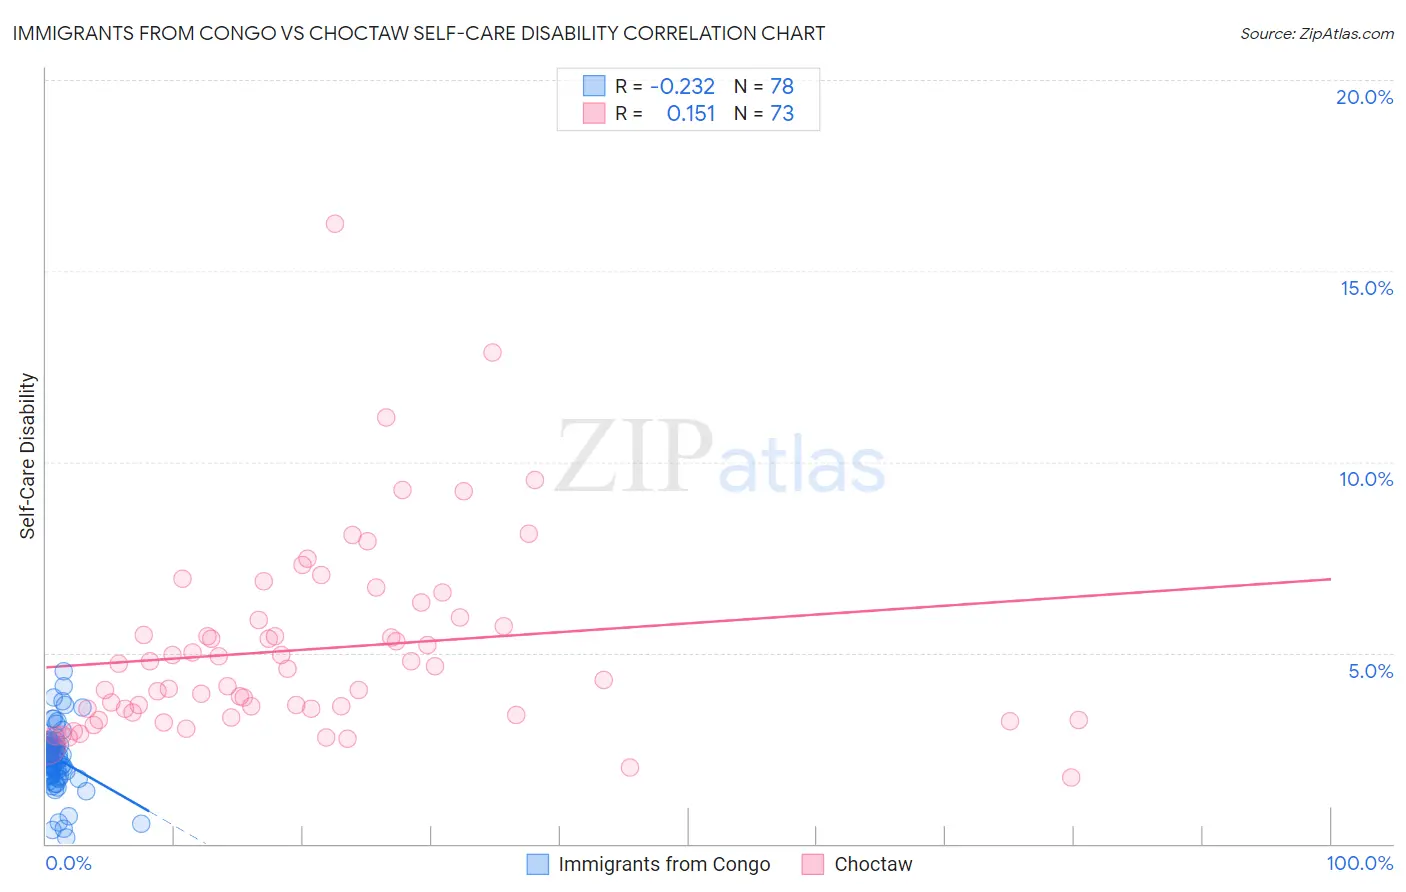
Immigrants from Congo vs Choctaw Self-Care Disability Correlation Chart
The statistical analysis conducted on geographies consisting of 92,100,672 people shows a weak negative correlation between the proportion of Immigrants from Congo and percentage of population with self-care disability in the United States with a correlation coefficient (R) of -0.232 and weighted average of 2.4%. Similarly, the statistical analysis conducted on geographies consisting of 269,470,857 people shows a poor positive correlation between the proportion of Choctaw and percentage of population with self-care disability in the United States with a correlation coefficient (R) of 0.151 and weighted average of 3.0%, a difference of 28.5%.
Self-Care Disability Correlation Summary
| Measurement | Immigrants from Congo | Choctaw |
| Minimum | 0.17% | 1.7% |
| Maximum | 4.5% | 16.2% |
| Range | 4.4% | 14.5% |
| Mean | 2.2% | 5.1% |
| Median | 2.3% | 4.6% |
| Interquartile 25% (IQ1) | 1.8% | 3.4% |
| Interquartile 75% (IQ3) | 2.6% | 5.9% |
| Interquartile Range (IQR) | 0.76% | 2.5% |
| Standard Deviation (Sample) | 0.81% | 2.5% |
| Standard Deviation (Population) | 0.80% | 2.5% |
Similar Demographics by Self-Care Disability
Demographics Similar to Immigrants from Congo by Self-Care Disability
In terms of self-care disability, the demographic groups most similar to Immigrants from Congo are Sierra Leonean (2.4%, a difference of 0.050%), Lithuanian (2.4%, a difference of 0.050%), Immigrants from Czechoslovakia (2.4%, a difference of 0.14%), Immigrants from Jordan (2.4%, a difference of 0.15%), and Immigrants from Northern Africa (2.3%, a difference of 0.19%).
| Demographics | Rating | Rank | Self-Care Disability |
| Immigrants | Denmark | 98.8 /100 | #82 | Exceptional 2.3% |
| Indians (Asian) | 98.7 /100 | #83 | Exceptional 2.3% |
| Immigrants | Spain | 98.7 /100 | #84 | Exceptional 2.3% |
| Estonians | 98.3 /100 | #85 | Exceptional 2.3% |
| Immigrants | Northern Africa | 98.2 /100 | #86 | Exceptional 2.3% |
| Sierra Leoneans | 98.0 /100 | #87 | Exceptional 2.4% |
| Lithuanians | 98.0 /100 | #88 | Exceptional 2.4% |
| Immigrants | Congo | 98.0 /100 | #89 | Exceptional 2.4% |
| Immigrants | Czechoslovakia | 97.7 /100 | #90 | Exceptional 2.4% |
| Immigrants | Jordan | 97.7 /100 | #91 | Exceptional 2.4% |
| Icelanders | 97.4 /100 | #92 | Exceptional 2.4% |
| Immigrants | Latvia | 97.0 /100 | #93 | Exceptional 2.4% |
| Macedonians | 96.9 /100 | #94 | Exceptional 2.4% |
| Immigrants | Asia | 96.9 /100 | #95 | Exceptional 2.4% |
| Immigrants | Chile | 96.7 /100 | #96 | Exceptional 2.4% |
Demographics Similar to Choctaw by Self-Care Disability
In terms of self-care disability, the demographic groups most similar to Choctaw are Cape Verdean (3.0%, a difference of 0.31%), Immigrants from Dominican Republic (3.0%, a difference of 0.69%), Immigrants from Cabo Verde (3.1%, a difference of 1.0%), Immigrants from Yemen (3.0%, a difference of 1.1%), and Immigrants from the Azores (3.0%, a difference of 1.2%).
| Demographics | Rating | Rank | Self-Care Disability |
| Nepalese | 0.0 /100 | #330 | Tragic 3.0% |
| Lumbee | 0.0 /100 | #331 | Tragic 3.0% |
| Kiowa | 0.0 /100 | #332 | Tragic 3.0% |
| Dutch West Indians | 0.0 /100 | #333 | Tragic 3.0% |
| Houma | 0.0 /100 | #334 | Tragic 3.0% |
| Immigrants | Azores | 0.0 /100 | #335 | Tragic 3.0% |
| Immigrants | Yemen | 0.0 /100 | #336 | Tragic 3.0% |
| Choctaw | 0.0 /100 | #337 | Tragic 3.0% |
| Cape Verdeans | 0.0 /100 | #338 | Tragic 3.0% |
| Immigrants | Dominican Republic | 0.0 /100 | #339 | Tragic 3.0% |
| Immigrants | Cabo Verde | 0.0 /100 | #340 | Tragic 3.1% |
| Dominicans | 0.0 /100 | #341 | Tragic 3.1% |
| Colville | 0.0 /100 | #342 | Tragic 3.1% |
| Tohono O'odham | 0.0 /100 | #343 | Tragic 3.1% |
| Pueblo | 0.0 /100 | #344 | Tragic 3.3% |