Immigrants from Chile vs Guyanese Male Disability
COMPARE
Immigrants from Chile
Guyanese
Male Disability
Male Disability Comparison
Immigrants from Chile
Guyanese
10.6%
MALE DISABILITY
98.3/ 100
METRIC RATING
81st/ 347
METRIC RANK
10.5%
MALE DISABILITY
99.2/ 100
METRIC RATING
66th/ 347
METRIC RANK
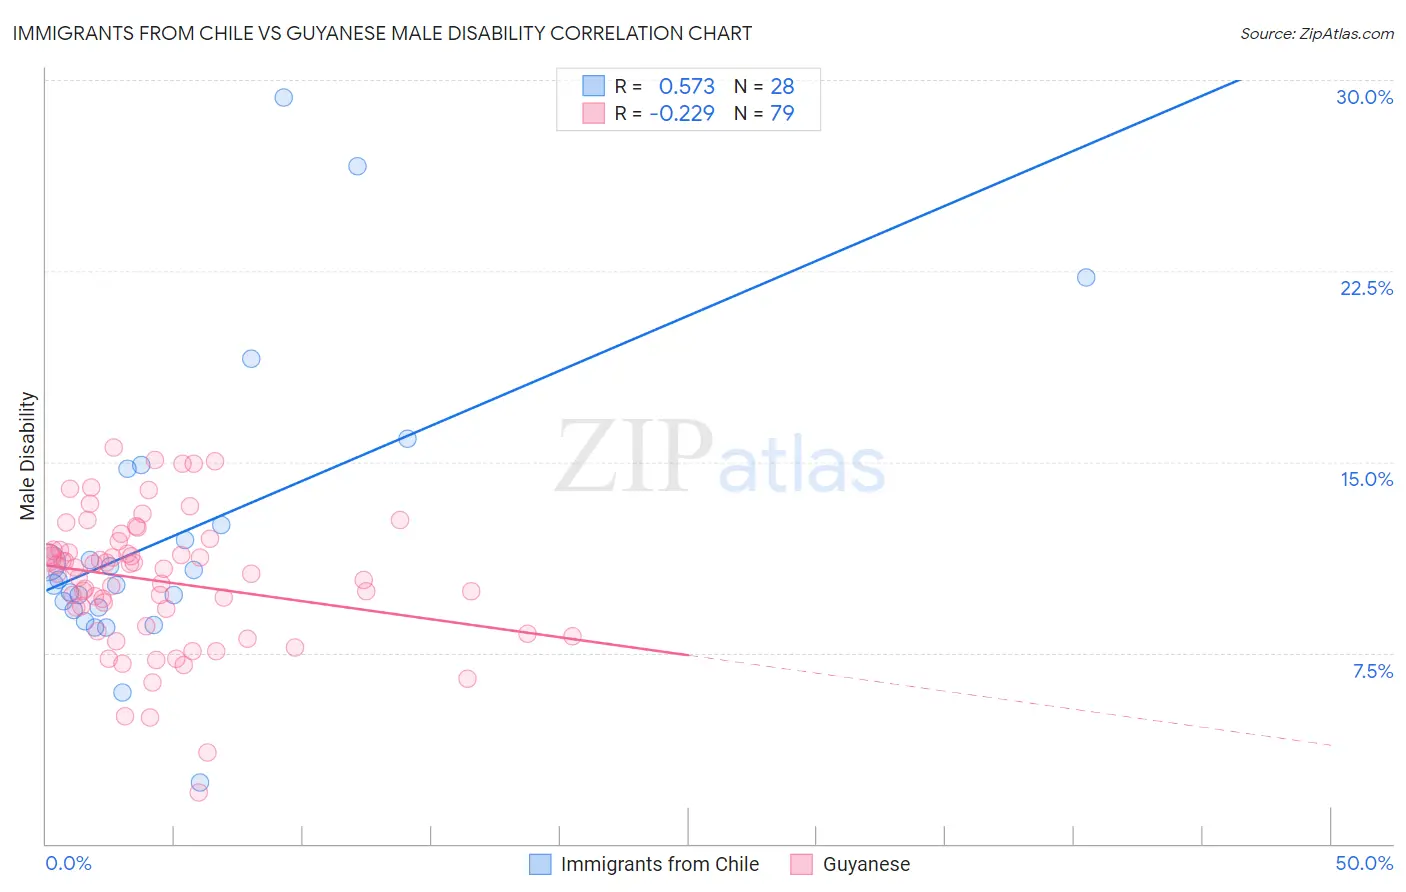
Immigrants from Chile vs Guyanese Male Disability Correlation Chart
The statistical analysis conducted on geographies consisting of 218,637,346 people shows a substantial positive correlation between the proportion of Immigrants from Chile and percentage of males with a disability in the United States with a correlation coefficient (R) of 0.573 and weighted average of 10.6%. Similarly, the statistical analysis conducted on geographies consisting of 176,893,996 people shows a weak negative correlation between the proportion of Guyanese and percentage of males with a disability in the United States with a correlation coefficient (R) of -0.229 and weighted average of 10.5%, a difference of 1.2%.
Male Disability Correlation Summary
| Measurement | Immigrants from Chile | Guyanese |
| Minimum | 2.4% | 2.0% |
| Maximum | 29.3% | 15.6% |
| Range | 26.9% | 13.6% |
| Mean | 12.2% | 10.3% |
| Median | 10.3% | 10.8% |
| Interquartile 25% (IQ1) | 9.2% | 8.5% |
| Interquartile 75% (IQ3) | 13.6% | 11.5% |
| Interquartile Range (IQR) | 4.4% | 3.0% |
| Standard Deviation (Sample) | 5.8% | 2.6% |
| Standard Deviation (Population) | 5.7% | 2.6% |
Demographics Similar to Immigrants from Chile and Guyanese by Male Disability
In terms of male disability, the demographic groups most similar to Immigrants from Chile are Immigrants from Jordan (10.6%, a difference of 0.060%), Immigrants from Guyana (10.6%, a difference of 0.070%), Zimbabwean (10.6%, a difference of 0.080%), Immigrants from Poland (10.6%, a difference of 0.13%), and Immigrants from Russia (10.6%, a difference of 0.30%). Similarly, the demographic groups most similar to Guyanese are Immigrants from Grenada (10.5%, a difference of 0.0%), Immigrants from Afghanistan (10.5%, a difference of 0.010%), Jordanian (10.5%, a difference of 0.030%), Colombian (10.5%, a difference of 0.10%), and Ecuadorian (10.5%, a difference of 0.11%).
| Demographics | Rating | Rank | Male Disability |
| Immigrants | Belarus | 99.3 /100 | #63 | Exceptional 10.4% |
| Jordanians | 99.3 /100 | #64 | Exceptional 10.5% |
| Immigrants | Grenada | 99.2 /100 | #65 | Exceptional 10.5% |
| Guyanese | 99.2 /100 | #66 | Exceptional 10.5% |
| Immigrants | Afghanistan | 99.2 /100 | #67 | Exceptional 10.5% |
| Colombians | 99.2 /100 | #68 | Exceptional 10.5% |
| Ecuadorians | 99.2 /100 | #69 | Exceptional 10.5% |
| Immigrants | Bulgaria | 99.1 /100 | #70 | Exceptional 10.5% |
| Immigrants | Cameroon | 99.0 /100 | #71 | Exceptional 10.5% |
| Immigrants | Serbia | 99.0 /100 | #72 | Exceptional 10.5% |
| Immigrants | Lithuania | 98.9 /100 | #73 | Exceptional 10.5% |
| Immigrants | Lebanon | 98.8 /100 | #74 | Exceptional 10.5% |
| Sierra Leoneans | 98.7 /100 | #75 | Exceptional 10.5% |
| Immigrants | Sierra Leone | 98.7 /100 | #76 | Exceptional 10.5% |
| Laotians | 98.6 /100 | #77 | Exceptional 10.6% |
| Immigrants | Russia | 98.6 /100 | #78 | Exceptional 10.6% |
| Zimbabweans | 98.4 /100 | #79 | Exceptional 10.6% |
| Immigrants | Jordan | 98.4 /100 | #80 | Exceptional 10.6% |
| Immigrants | Chile | 98.3 /100 | #81 | Exceptional 10.6% |
| Immigrants | Guyana | 98.2 /100 | #82 | Exceptional 10.6% |
| Immigrants | Poland | 98.1 /100 | #83 | Exceptional 10.6% |