Immigrants from Canada vs Cuban Disability Age Under 5
COMPARE
Immigrants from Canada
Cuban
Disability Age Under 5
Disability Age Under 5 Comparison
Immigrants from Canada
Cubans
1.4%
DISABILITY AGE UNDER 5
0.1/ 100
METRIC RATING
271st/ 347
METRIC RANK
1.2%
DISABILITY AGE UNDER 5
42.5/ 100
METRIC RATING
186th/ 347
METRIC RANK
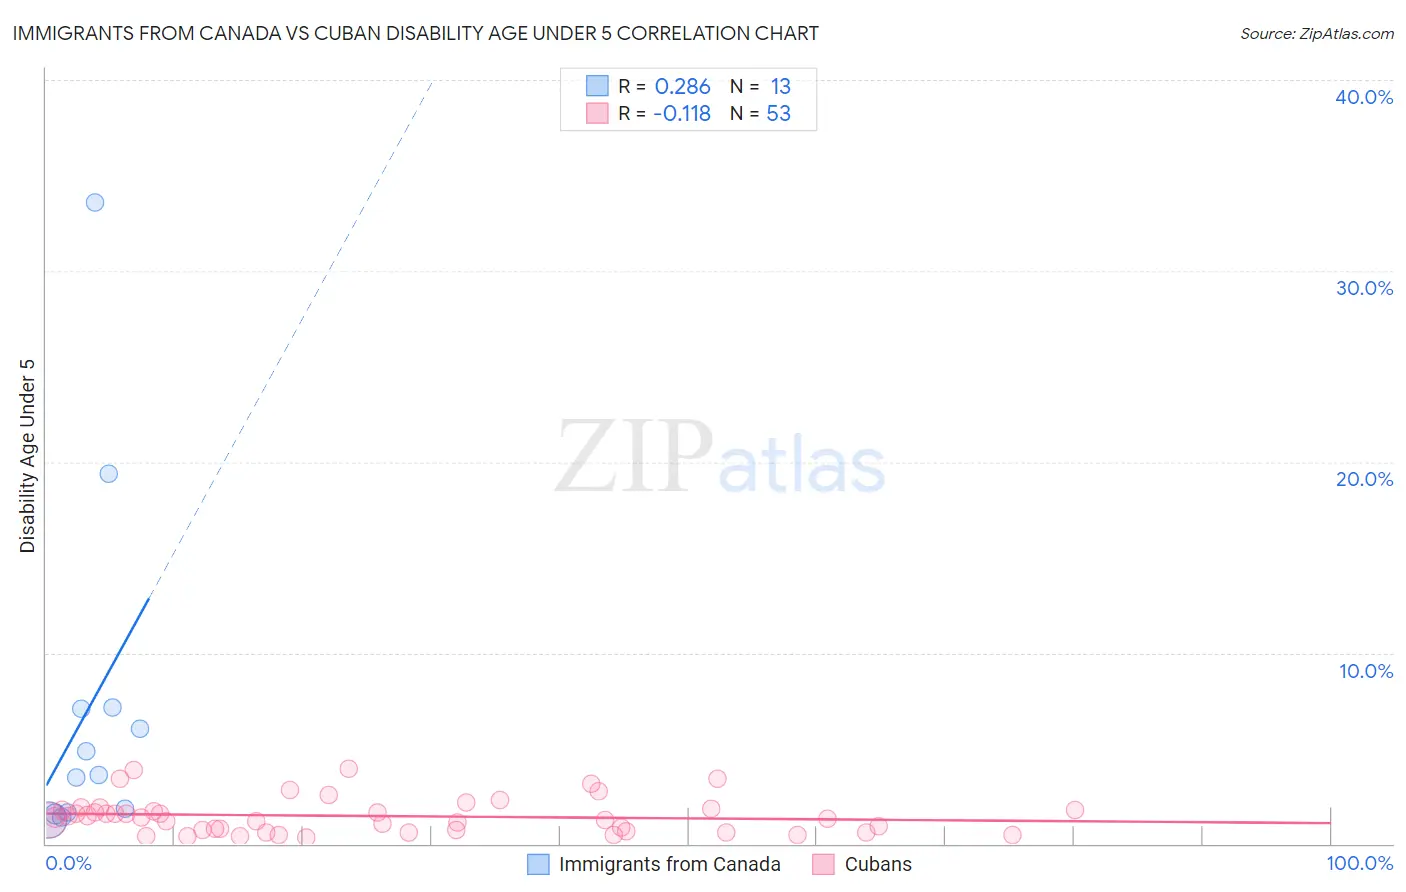
Immigrants from Canada vs Cuban Disability Age Under 5 Correlation Chart
The statistical analysis conducted on geographies consisting of 233,728,929 people shows a weak positive correlation between the proportion of Immigrants from Canada and percentage of population with a disability under the age of 5 in the United States with a correlation coefficient (R) of 0.286 and weighted average of 1.4%. Similarly, the statistical analysis conducted on geographies consisting of 234,247,835 people shows a poor negative correlation between the proportion of Cubans and percentage of population with a disability under the age of 5 in the United States with a correlation coefficient (R) of -0.118 and weighted average of 1.2%, a difference of 15.7%.
Disability Age Under 5 Correlation Summary
| Measurement | Immigrants from Canada | Cuban |
| Minimum | 1.3% | 0.29% |
| Maximum | 33.6% | 3.9% |
| Range | 32.3% | 3.6% |
| Mean | 7.1% | 1.5% |
| Median | 3.6% | 1.4% |
| Interquartile 25% (IQ1) | 1.6% | 0.66% |
| Interquartile 75% (IQ3) | 7.1% | 1.8% |
| Interquartile Range (IQR) | 5.5% | 1.1% |
| Standard Deviation (Sample) | 9.3% | 0.93% |
| Standard Deviation (Population) | 8.9% | 0.92% |
Similar Demographics by Disability Age Under 5
Demographics Similar to Immigrants from Canada by Disability Age Under 5
In terms of disability age under 5, the demographic groups most similar to Immigrants from Canada are Immigrants from North America (1.4%, a difference of 0.040%), Black/African American (1.4%, a difference of 0.16%), Austrian (1.4%, a difference of 0.17%), Belgian (1.4%, a difference of 0.35%), and Alaskan Athabascan (1.5%, a difference of 0.46%).
| Demographics | Rating | Rank | Disability Age Under 5 |
| Yugoslavians | 0.1 /100 | #264 | Tragic 1.4% |
| Carpatho Rusyns | 0.1 /100 | #265 | Tragic 1.4% |
| Immigrants | Germany | 0.1 /100 | #266 | Tragic 1.4% |
| Cree | 0.1 /100 | #267 | Tragic 1.4% |
| Belgians | 0.1 /100 | #268 | Tragic 1.4% |
| Austrians | 0.1 /100 | #269 | Tragic 1.4% |
| Immigrants | North America | 0.1 /100 | #270 | Tragic 1.4% |
| Immigrants | Canada | 0.1 /100 | #271 | Tragic 1.4% |
| Blacks/African Americans | 0.1 /100 | #272 | Tragic 1.4% |
| Alaskan Athabascans | 0.1 /100 | #273 | Tragic 1.5% |
| Iroquois | 0.0 /100 | #274 | Tragic 1.5% |
| Brazilians | 0.0 /100 | #275 | Tragic 1.5% |
| Greeks | 0.0 /100 | #276 | Tragic 1.5% |
| Canadians | 0.0 /100 | #277 | Tragic 1.5% |
| Kiowa | 0.0 /100 | #278 | Tragic 1.5% |
Demographics Similar to Cubans by Disability Age Under 5
In terms of disability age under 5, the demographic groups most similar to Cubans are Immigrants from Western Africa (1.2%, a difference of 0.0%), Palestinian (1.2%, a difference of 0.050%), Immigrants from Saudi Arabia (1.2%, a difference of 0.080%), Macedonian (1.2%, a difference of 0.12%), and Immigrants from Peru (1.2%, a difference of 0.12%).
| Demographics | Rating | Rank | Disability Age Under 5 |
| Immigrants | Bahamas | 45.2 /100 | #179 | Average 1.2% |
| Immigrants | Mexico | 44.4 /100 | #180 | Average 1.2% |
| Macedonians | 43.7 /100 | #181 | Average 1.2% |
| Immigrants | Peru | 43.7 /100 | #181 | Average 1.2% |
| Immigrants | Saudi Arabia | 43.3 /100 | #183 | Average 1.2% |
| Palestinians | 43.0 /100 | #184 | Average 1.2% |
| Immigrants | Western Africa | 42.5 /100 | #185 | Average 1.2% |
| Cubans | 42.5 /100 | #186 | Average 1.2% |
| Immigrants | Haiti | 40.2 /100 | #187 | Average 1.3% |
| Haitians | 39.9 /100 | #188 | Fair 1.3% |
| Peruvians | 37.6 /100 | #189 | Fair 1.3% |
| Immigrants | Laos | 36.6 /100 | #190 | Fair 1.3% |
| Mexican American Indians | 36.6 /100 | #191 | Fair 1.3% |
| Immigrants | Bosnia and Herzegovina | 36.5 /100 | #192 | Fair 1.3% |
| Immigrants | Sierra Leone | 36.5 /100 | #193 | Fair 1.3% |