Immigrants from Canada vs Ghanaian Disability Age Under 5
COMPARE
Immigrants from Canada
Ghanaian
Disability Age Under 5
Disability Age Under 5 Comparison
Immigrants from Canada
Ghanaians
1.4%
DISABILITY AGE UNDER 5
0.1/ 100
METRIC RATING
271st/ 347
METRIC RANK
1.2%
DISABILITY AGE UNDER 5
76.3/ 100
METRIC RATING
148th/ 347
METRIC RANK
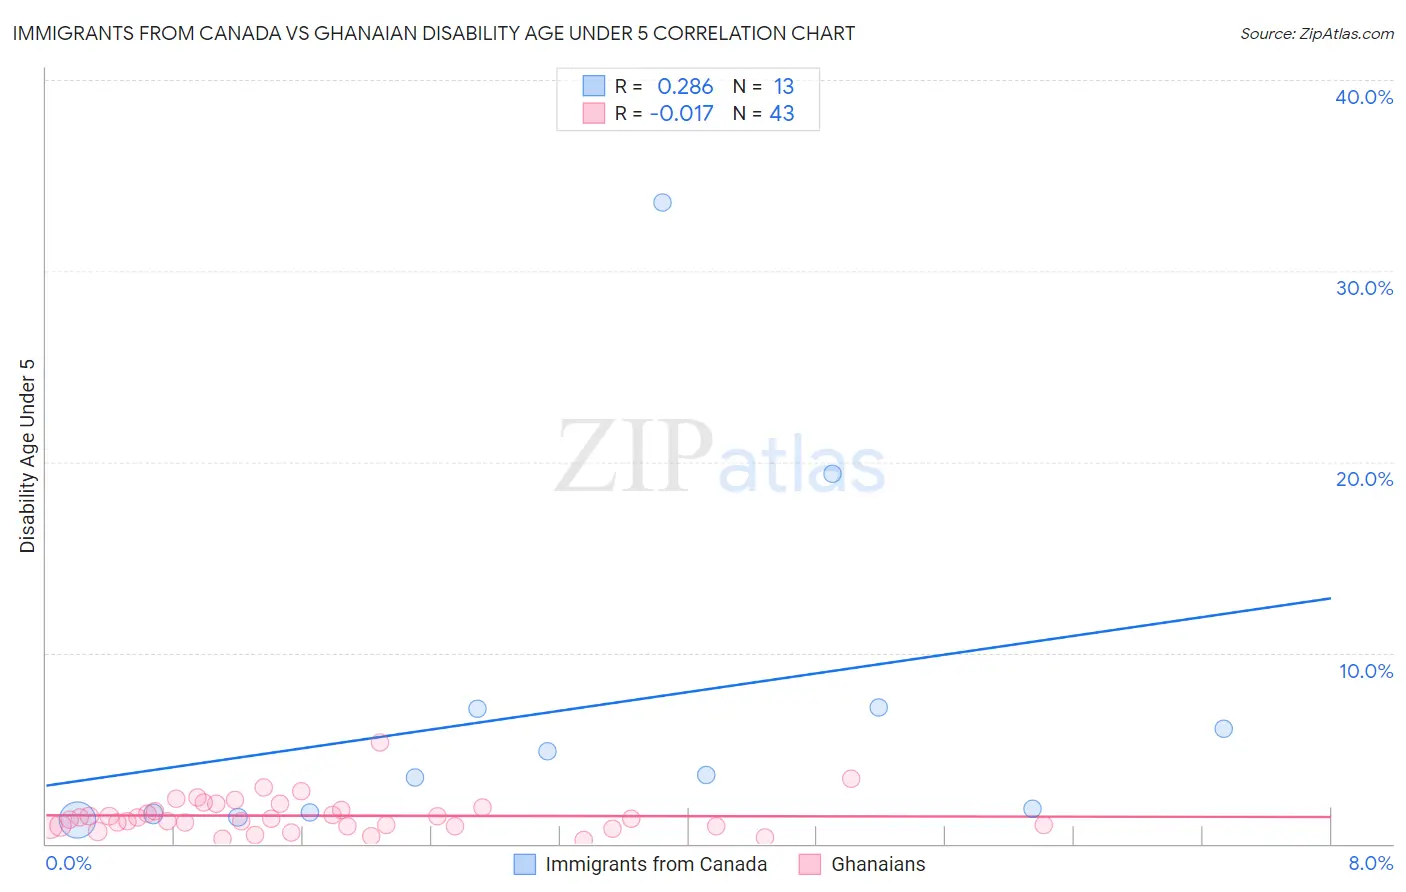
Immigrants from Canada vs Ghanaian Disability Age Under 5 Correlation Chart
The statistical analysis conducted on geographies consisting of 233,728,929 people shows a weak positive correlation between the proportion of Immigrants from Canada and percentage of population with a disability under the age of 5 in the United States with a correlation coefficient (R) of 0.286 and weighted average of 1.4%. Similarly, the statistical analysis conducted on geographies consisting of 127,583,107 people shows no correlation between the proportion of Ghanaians and percentage of population with a disability under the age of 5 in the United States with a correlation coefficient (R) of -0.017 and weighted average of 1.2%, a difference of 19.6%.
Disability Age Under 5 Correlation Summary
| Measurement | Immigrants from Canada | Ghanaian |
| Minimum | 1.3% | 0.20% |
| Maximum | 33.6% | 5.3% |
| Range | 32.3% | 5.1% |
| Mean | 7.1% | 1.5% |
| Median | 3.6% | 1.3% |
| Interquartile 25% (IQ1) | 1.6% | 0.94% |
| Interquartile 75% (IQ3) | 7.1% | 1.9% |
| Interquartile Range (IQR) | 5.5% | 0.97% |
| Standard Deviation (Sample) | 9.3% | 0.94% |
| Standard Deviation (Population) | 8.9% | 0.93% |
Similar Demographics by Disability Age Under 5
Demographics Similar to Immigrants from Canada by Disability Age Under 5
In terms of disability age under 5, the demographic groups most similar to Immigrants from Canada are Immigrants from North America (1.4%, a difference of 0.040%), Black/African American (1.4%, a difference of 0.16%), Austrian (1.4%, a difference of 0.17%), Belgian (1.4%, a difference of 0.35%), and Alaskan Athabascan (1.5%, a difference of 0.46%).
| Demographics | Rating | Rank | Disability Age Under 5 |
| Yugoslavians | 0.1 /100 | #264 | Tragic 1.4% |
| Carpatho Rusyns | 0.1 /100 | #265 | Tragic 1.4% |
| Immigrants | Germany | 0.1 /100 | #266 | Tragic 1.4% |
| Cree | 0.1 /100 | #267 | Tragic 1.4% |
| Belgians | 0.1 /100 | #268 | Tragic 1.4% |
| Austrians | 0.1 /100 | #269 | Tragic 1.4% |
| Immigrants | North America | 0.1 /100 | #270 | Tragic 1.4% |
| Immigrants | Canada | 0.1 /100 | #271 | Tragic 1.4% |
| Blacks/African Americans | 0.1 /100 | #272 | Tragic 1.4% |
| Alaskan Athabascans | 0.1 /100 | #273 | Tragic 1.5% |
| Iroquois | 0.0 /100 | #274 | Tragic 1.5% |
| Brazilians | 0.0 /100 | #275 | Tragic 1.5% |
| Greeks | 0.0 /100 | #276 | Tragic 1.5% |
| Canadians | 0.0 /100 | #277 | Tragic 1.5% |
| Kiowa | 0.0 /100 | #278 | Tragic 1.5% |
Demographics Similar to Ghanaians by Disability Age Under 5
In terms of disability age under 5, the demographic groups most similar to Ghanaians are Icelander (1.2%, a difference of 0.010%), Kenyan (1.2%, a difference of 0.050%), South American (1.2%, a difference of 0.090%), Samoan (1.2%, a difference of 0.19%), and Yaqui (1.2%, a difference of 0.19%).
| Demographics | Rating | Rank | Disability Age Under 5 |
| Immigrants | Honduras | 80.4 /100 | #141 | Excellent 1.2% |
| Immigrants | Colombia | 79.3 /100 | #142 | Good 1.2% |
| Alsatians | 79.3 /100 | #143 | Good 1.2% |
| Immigrants | Middle Africa | 79.3 /100 | #144 | Good 1.2% |
| Immigrants | Zimbabwe | 77.9 /100 | #145 | Good 1.2% |
| Samoans | 77.7 /100 | #146 | Good 1.2% |
| Icelanders | 76.3 /100 | #147 | Good 1.2% |
| Ghanaians | 76.3 /100 | #148 | Good 1.2% |
| Kenyans | 75.9 /100 | #149 | Good 1.2% |
| South Americans | 75.6 /100 | #150 | Good 1.2% |
| Yaqui | 74.8 /100 | #151 | Good 1.2% |
| Hondurans | 72.5 /100 | #152 | Good 1.2% |
| Immigrants | Thailand | 69.4 /100 | #153 | Good 1.2% |
| Uruguayans | 68.8 /100 | #154 | Good 1.2% |
| Immigrants | Ghana | 68.7 /100 | #155 | Good 1.2% |