Immigrants from Canada vs Trinidadian and Tobagonian Disability Age Under 5
COMPARE
Immigrants from Canada
Trinidadian and Tobagonian
Disability Age Under 5
Disability Age Under 5 Comparison
Immigrants from Canada
Trinidadians and Tobagonians
1.4%
DISABILITY AGE UNDER 5
0.1/ 100
METRIC RATING
271st/ 347
METRIC RANK
1.1%
DISABILITY AGE UNDER 5
98.6/ 100
METRIC RATING
71st/ 347
METRIC RANK
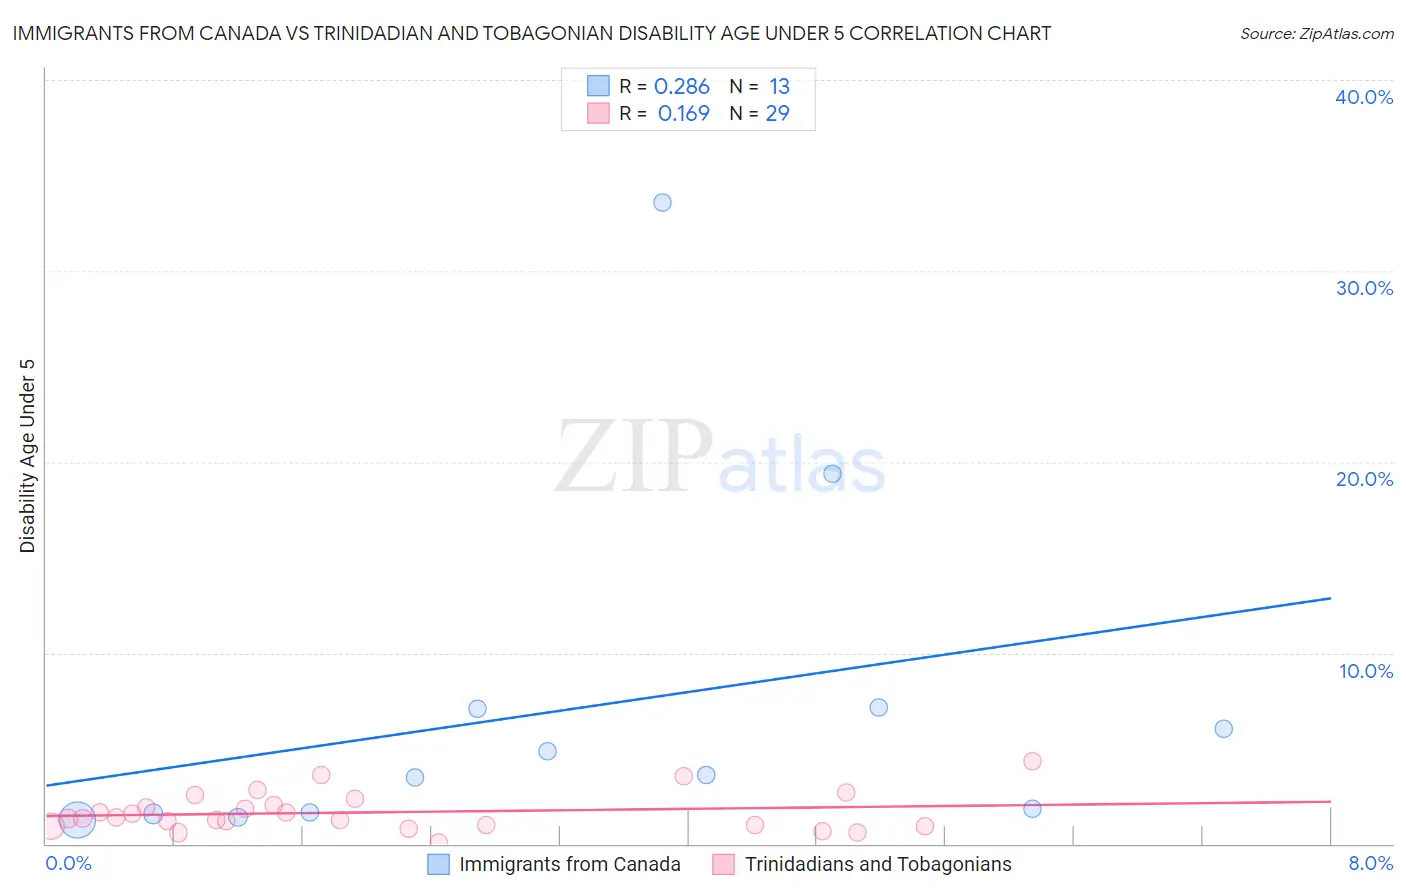
Immigrants from Canada vs Trinidadian and Tobagonian Disability Age Under 5 Correlation Chart
The statistical analysis conducted on geographies consisting of 233,728,929 people shows a weak positive correlation between the proportion of Immigrants from Canada and percentage of population with a disability under the age of 5 in the United States with a correlation coefficient (R) of 0.286 and weighted average of 1.4%. Similarly, the statistical analysis conducted on geographies consisting of 140,023,510 people shows a poor positive correlation between the proportion of Trinidadians and Tobagonians and percentage of population with a disability under the age of 5 in the United States with a correlation coefficient (R) of 0.169 and weighted average of 1.1%, a difference of 28.8%.
Disability Age Under 5 Correlation Summary
| Measurement | Immigrants from Canada | Trinidadian and Tobagonian |
| Minimum | 1.3% | 0.086% |
| Maximum | 33.6% | 4.3% |
| Range | 32.3% | 4.2% |
| Mean | 7.1% | 1.6% |
| Median | 3.6% | 1.3% |
| Interquartile 25% (IQ1) | 1.6% | 0.94% |
| Interquartile 75% (IQ3) | 7.1% | 2.2% |
| Interquartile Range (IQR) | 5.5% | 1.3% |
| Standard Deviation (Sample) | 9.3% | 1.0% |
| Standard Deviation (Population) | 8.9% | 0.98% |
Similar Demographics by Disability Age Under 5
Demographics Similar to Immigrants from Canada by Disability Age Under 5
In terms of disability age under 5, the demographic groups most similar to Immigrants from Canada are Immigrants from North America (1.4%, a difference of 0.040%), Black/African American (1.4%, a difference of 0.16%), Austrian (1.4%, a difference of 0.17%), Belgian (1.4%, a difference of 0.35%), and Alaskan Athabascan (1.5%, a difference of 0.46%).
| Demographics | Rating | Rank | Disability Age Under 5 |
| Yugoslavians | 0.1 /100 | #264 | Tragic 1.4% |
| Carpatho Rusyns | 0.1 /100 | #265 | Tragic 1.4% |
| Immigrants | Germany | 0.1 /100 | #266 | Tragic 1.4% |
| Cree | 0.1 /100 | #267 | Tragic 1.4% |
| Belgians | 0.1 /100 | #268 | Tragic 1.4% |
| Austrians | 0.1 /100 | #269 | Tragic 1.4% |
| Immigrants | North America | 0.1 /100 | #270 | Tragic 1.4% |
| Immigrants | Canada | 0.1 /100 | #271 | Tragic 1.4% |
| Blacks/African Americans | 0.1 /100 | #272 | Tragic 1.4% |
| Alaskan Athabascans | 0.1 /100 | #273 | Tragic 1.5% |
| Iroquois | 0.0 /100 | #274 | Tragic 1.5% |
| Brazilians | 0.0 /100 | #275 | Tragic 1.5% |
| Greeks | 0.0 /100 | #276 | Tragic 1.5% |
| Canadians | 0.0 /100 | #277 | Tragic 1.5% |
| Kiowa | 0.0 /100 | #278 | Tragic 1.5% |
Demographics Similar to Trinidadians and Tobagonians by Disability Age Under 5
In terms of disability age under 5, the demographic groups most similar to Trinidadians and Tobagonians are Immigrants from Ecuador (1.1%, a difference of 0.060%), Israeli (1.1%, a difference of 0.15%), Burmese (1.1%, a difference of 0.16%), South African (1.1%, a difference of 0.17%), and Immigrants from Belize (1.1%, a difference of 0.21%).
| Demographics | Rating | Rank | Disability Age Under 5 |
| Egyptians | 98.9 /100 | #64 | Exceptional 1.1% |
| Immigrants | Korea | 98.8 /100 | #65 | Exceptional 1.1% |
| Immigrants | Indonesia | 98.7 /100 | #66 | Exceptional 1.1% |
| Immigrants | Belize | 98.7 /100 | #67 | Exceptional 1.1% |
| South Africans | 98.7 /100 | #68 | Exceptional 1.1% |
| Israelis | 98.7 /100 | #69 | Exceptional 1.1% |
| Immigrants | Ecuador | 98.6 /100 | #70 | Exceptional 1.1% |
| Trinidadians and Tobagonians | 98.6 /100 | #71 | Exceptional 1.1% |
| Burmese | 98.5 /100 | #72 | Exceptional 1.1% |
| Immigrants | Sri Lanka | 98.5 /100 | #73 | Exceptional 1.1% |
| Jordanians | 98.5 /100 | #74 | Exceptional 1.1% |
| Immigrants | Pakistan | 98.4 /100 | #75 | Exceptional 1.1% |
| Immigrants | Burma/Myanmar | 98.2 /100 | #76 | Exceptional 1.1% |
| Immigrants | Denmark | 98.1 /100 | #77 | Exceptional 1.1% |
| West Indians | 98.0 /100 | #78 | Exceptional 1.1% |