Immigrants vs Cuban Disability Age Under 5
COMPARE
Immigrants
Cuban
Disability Age Under 5
Disability Age Under 5 Comparison
Immigrants
Cubans
1.2%
DISABILITY AGE UNDER 5
88.0/ 100
METRIC RATING
129th/ 347
METRIC RANK
1.2%
DISABILITY AGE UNDER 5
42.5/ 100
METRIC RATING
186th/ 347
METRIC RANK
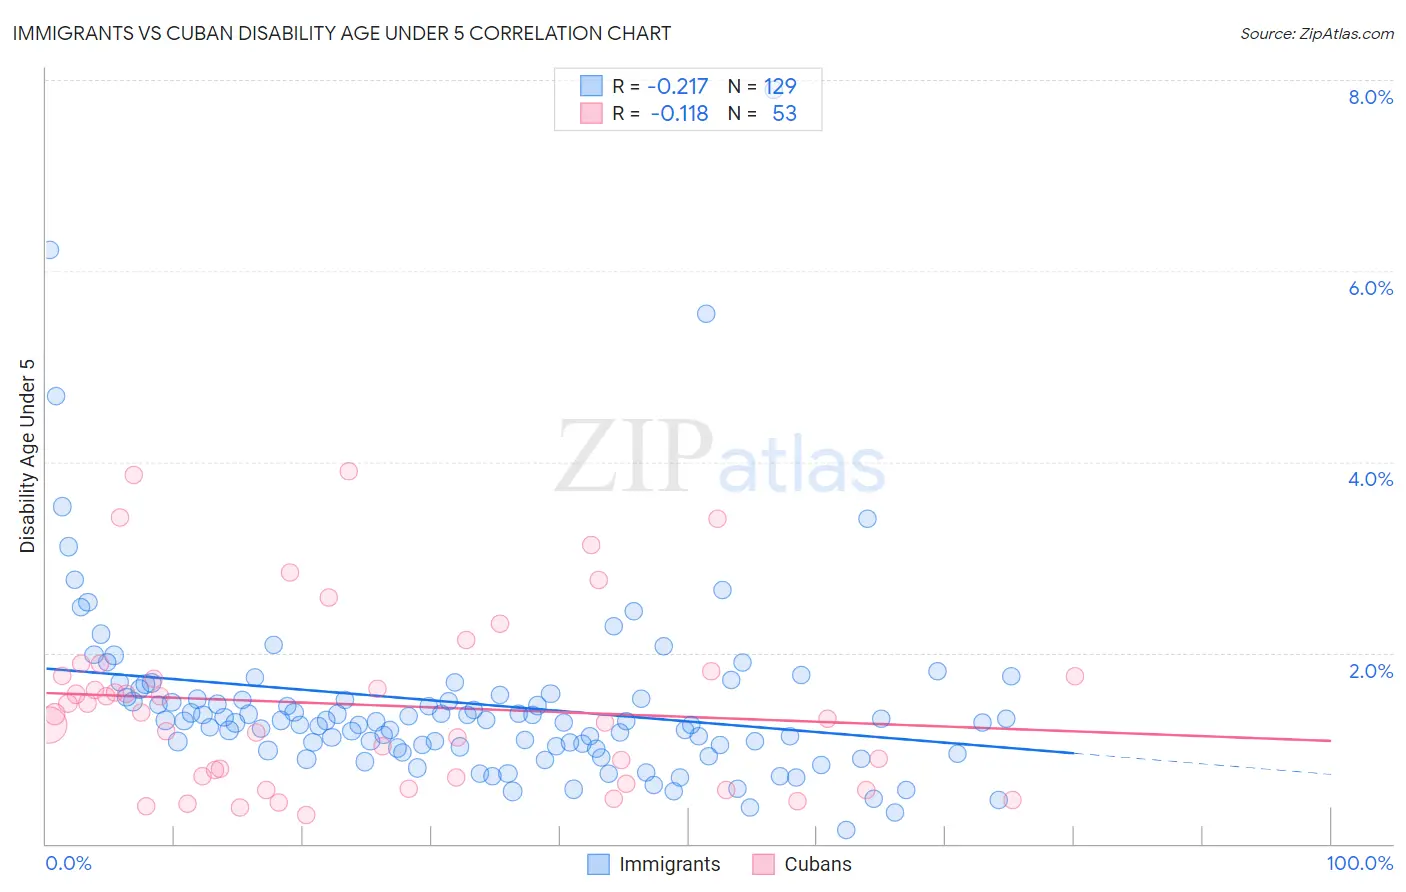
Immigrants vs Cuban Disability Age Under 5 Correlation Chart
The statistical analysis conducted on geographies consisting of 262,190,696 people shows a weak negative correlation between the proportion of Immigrants and percentage of population with a disability under the age of 5 in the United States with a correlation coefficient (R) of -0.217 and weighted average of 1.2%. Similarly, the statistical analysis conducted on geographies consisting of 234,247,835 people shows a poor negative correlation between the proportion of Cubans and percentage of population with a disability under the age of 5 in the United States with a correlation coefficient (R) of -0.118 and weighted average of 1.2%, a difference of 5.4%.
Disability Age Under 5 Correlation Summary
| Measurement | Immigrants | Cuban |
| Minimum | 0.14% | 0.29% |
| Maximum | 7.9% | 3.9% |
| Range | 7.8% | 3.6% |
| Mean | 1.5% | 1.5% |
| Median | 1.3% | 1.4% |
| Interquartile 25% (IQ1) | 1.0% | 0.66% |
| Interquartile 75% (IQ3) | 1.5% | 1.8% |
| Interquartile Range (IQR) | 0.54% | 1.1% |
| Standard Deviation (Sample) | 1.0% | 0.93% |
| Standard Deviation (Population) | 1.0% | 0.92% |
Similar Demographics by Disability Age Under 5
Demographics Similar to Immigrants by Disability Age Under 5
In terms of disability age under 5, the demographic groups most similar to Immigrants are Korean (1.2%, a difference of 0.080%), Immigrants from Romania (1.2%, a difference of 0.090%), Immigrants from France (1.2%, a difference of 0.090%), Immigrants from Serbia (1.2%, a difference of 0.090%), and Immigrants from Eastern Europe (1.2%, a difference of 0.16%).
| Demographics | Rating | Rank | Disability Age Under 5 |
| Aleuts | 90.7 /100 | #122 | Exceptional 1.2% |
| Zimbabweans | 90.6 /100 | #123 | Exceptional 1.2% |
| Immigrants | Cambodia | 90.5 /100 | #124 | Exceptional 1.2% |
| Japanese | 90.3 /100 | #125 | Exceptional 1.2% |
| Central Americans | 89.7 /100 | #126 | Excellent 1.2% |
| Immigrants | Romania | 88.4 /100 | #127 | Excellent 1.2% |
| Immigrants | France | 88.4 /100 | #128 | Excellent 1.2% |
| Immigrants | Immigrants | 88.0 /100 | #129 | Excellent 1.2% |
| Koreans | 87.7 /100 | #130 | Excellent 1.2% |
| Immigrants | Serbia | 87.6 /100 | #131 | Excellent 1.2% |
| Immigrants | Eastern Europe | 87.3 /100 | #132 | Excellent 1.2% |
| Immigrants | Spain | 86.5 /100 | #133 | Excellent 1.2% |
| Argentineans | 85.7 /100 | #134 | Excellent 1.2% |
| Fijians | 84.7 /100 | #135 | Excellent 1.2% |
| Moroccans | 83.6 /100 | #136 | Excellent 1.2% |
Demographics Similar to Cubans by Disability Age Under 5
In terms of disability age under 5, the demographic groups most similar to Cubans are Immigrants from Western Africa (1.2%, a difference of 0.0%), Palestinian (1.2%, a difference of 0.050%), Immigrants from Saudi Arabia (1.2%, a difference of 0.080%), Macedonian (1.2%, a difference of 0.12%), and Immigrants from Peru (1.2%, a difference of 0.12%).
| Demographics | Rating | Rank | Disability Age Under 5 |
| Immigrants | Bahamas | 45.2 /100 | #179 | Average 1.2% |
| Immigrants | Mexico | 44.4 /100 | #180 | Average 1.2% |
| Macedonians | 43.7 /100 | #181 | Average 1.2% |
| Immigrants | Peru | 43.7 /100 | #181 | Average 1.2% |
| Immigrants | Saudi Arabia | 43.3 /100 | #183 | Average 1.2% |
| Palestinians | 43.0 /100 | #184 | Average 1.2% |
| Immigrants | Western Africa | 42.5 /100 | #185 | Average 1.2% |
| Cubans | 42.5 /100 | #186 | Average 1.2% |
| Immigrants | Haiti | 40.2 /100 | #187 | Average 1.3% |
| Haitians | 39.9 /100 | #188 | Fair 1.3% |
| Peruvians | 37.6 /100 | #189 | Fair 1.3% |
| Immigrants | Laos | 36.6 /100 | #190 | Fair 1.3% |
| Mexican American Indians | 36.6 /100 | #191 | Fair 1.3% |
| Immigrants | Bosnia and Herzegovina | 36.5 /100 | #192 | Fair 1.3% |
| Immigrants | Sierra Leone | 36.5 /100 | #193 | Fair 1.3% |